Each month we compile a short-list of recently-published papers (full list here) in the world of running science and break them into bite-sized chunks so you can digest them as food for thought to help optimise your training. To help wash it all down, we even review our favourite beer of the month.
Welcome to this month's installment of our "Nerd Alert". We hope you enjoy it.
Share this nerd alert:
Click the title of each article to "drop-down" the summary.
What was the hypothesis or research question?
The phenomenon of “hitting the wall” during a marathon is associated with many physiological, neuromuscular, biomechanical, and perceptual variables. Anecdotally, folks say this happens at the 30 km/20 mile mark but it is highly-variable and does not always occur. To better understand the biomechanical factors involved, this study aimed to continuously measure changes in spatiotemporal parameters, stiffness, and foot strike angles in recreational runners during a marathon. No hypothesis was stated.
What did they do to test the hypothesis or answer the research question?
— 12 recreational runners (8 males, 4 females; age: 36 ± 10 years; weight: 72 ± 6 kg; race time 179–246 min, ~3 to ~4-hours) were equipped with a GPS watch and two inertial measurement units (the Physilog 5, which includes an accelerometer and gyroscope) were clamped to the shoe on the dorsum of each foot during the 2017 Geneva marathon on a cool day (average temperature: 13 °C).
— Data were split into eight 5 km sections and only level parts were analyzed.
— Due to the nature of the course, the 5-10 km and 25-30 km sections were identical; therefore, statistical comparisons were made between these two sections.
What did they find?
— Foot strike angle (-16%), maximal ground reaction force (-5.4%), time-in-air “flight time” (-8.7%) were significantly lower and ground contact time (+6.5%) was significantly higher at 25-30 km compared to 5-10 km.
— Flight time was further decreased and ground contact time was further increased at the 35-42 km section compared to 5-10 km.
— Despite a decreased foot strike angle, every participant maintained a rearfoot strike until the end of the race.
— Stride time was consistent throughout the race but stride length progressively decreased, reaching significance at 25-30 km with a further decrease at 35-42 km.
— Running speed also significantly decreased at 25-30 km with a further drop at 35-42 km.
— Compared to the 5-10 km section, maximal ground reaction force, vertical stiffness, and leg stiffness were already significantly lowered by the 10-15 km section, remaining lower with a decreasing trend throughout the remainder of the race.
What were the strengths?
— Power calculations to justify their sample size were described.
— High ecological validity of studying trained runners in a real marathon race.
— Nice presentation of the temporal changes in variables during the race.
— R-squared values were used to assess the
effect sizea quantitative measure of the magnitude of the experimental effect. Less than 0.5 is small, greater than 0.8 is large.
of observed changes.
What were the weaknesses?
— Subject recruitment is not described so it is unclear if they are a random selection, which would minimise confounding effects.
— No info is presented regarding subjects’ training and nutritional habits leading into or during the race — How well prepared were they? Were they “glycogen loaded”? Did they maintain high carb availability during the race? Were they euhydrated? I.e. factors that could influence “hitting the wall”.
— Although GPS data was parsed, subjects wore their own GPS watches, which would introduce bias, and the brands and models were not stated.
— No pre-trial calibration or validation of the inertial measurement units was reported, nor were any citations made to validation papers.
Are the findings useful in application to training/coaching practice?
No.
The findings make for an interesting observation of the deterioration in biomechanics in recreational runners during a marathon but the findings do not inform how best to prepare to prevent said deterioration. Furthermore, the changes in biomechanics were not analysed in line with race finish time — we do not know whether specific changes may be associated with running speed. Since the observations were made in ~3- to 4-hour marathoners, the findings cannot be extrapolated to elite and sub elite marathoners, who are likely better trained and better prepared for a marathon.
What was the hypothesis or research question?
Because VO2max is indicative of a person’s cardiorespiratory fitness and is associated with health, some folks like to know their VO2max value. But it requires technical expertise and equipment to measure. So, there are several estimates derived from algorithms, some of which are used by companies like Garmin and Polar who make consumer wearables. Surprisingly, however, there are no validation studies. So, the aim of this study was to compare measured VO2max with predicted VO2max values from the Polar V800 and Garmin Forerunner 230. No hypothesis was stated.
What did they do to test the hypothesis or answer the research question?
— 44 young (age 19-35 y), healthy men and women (22 females) were recruited. They had a range of training history, from 1-3 hours per week to more than 12 hours/wk.
— Actual VO2max and Polar-predicted VO2max were measured during a single lab visit and Garmin-predicted VO2max was measured within 48 hours of the lab visit.
— VO2max was measured on a treadmill using a Bruce protocol (starts at 10% grade and ~3kph/2mph with 2% increments in grade and ~1.5kph/1mph increase in speed every 3-mins).
— The “Polar Fitness Test”, which collects chest-strap heart rate data and GPS data (time, distance, pace) was used to generate the Polar-predicted VO2max. The Garmin-predicted VO2max was derived from a 10-minute test during which chest-strap heart rate data and GPS data (time, distance, pace) were collected. For both devices, subjects’ age, sex, weight, and height were entered prior to the tests.
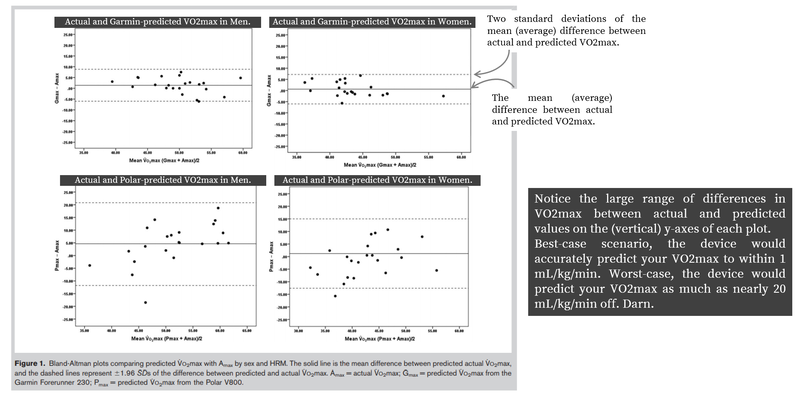
— Pearson’s coefficients were used to determine if the actual vs. predicted values were correlated. Bland-Altman plots, which compare the difference between predicted and actual vs. the average of predicted and actual, were used to identify the 95% limits of agreement between the predicted and actual VO2max.
What did they find?
— Actual VO2max values were 43.2±5.5 mL/kg/min in females and 49.1±5.6 in males (data are mean ± standard deviation).
— Pearson’s correlation coefficients between predicted and actual VO2max were significant and moderate-to-large for both men (r = 0.762, p = 0.001) and women (r = 0.801, p = 0.001) for the Garmin device, and significant and moderate for both men (r = 0.548, p = 0.008) and women (r = 0.520, p = 0.013) for the Polar device.
— Bland-Altman plots showed large random errors between predicted vs. actual VO2max, ranging from 6.6 to 16.4 mL/kg/min.
— The Polar V800 showed larger errors between predicted vs. actual VO2max than the Garmin Forerunner 230.
— There was a significant interaction (P = 0.007) between HR monitors and sex, which showed that the Polar V800 significantly overestimated VO2max by ~ 4 mL/kg/min in men compared to the Garmin Forerunner 230.
What were the strengths?
— The use of correlation coefficients (Pearson) and comparisons of agreement (Bland-Altman) is important — the device-derived metrics were well correlated with actual values but the comparisons of agreement showed large random error.
What were the weaknesses?
— Recruitment procedures were not described so it is unclear whether participants were a random sample of the target population, which would minimise confounding factors.
— Both Polar-predicted and Garmin-predicted VO2max use “black box” proprietary algorithms so it is not possible to understand how they are calculated or why errors arise.
Are the findings useful in application to training/coaching practice?
Yes.
Predicting a VO2max does not tell an athlete anything about their performance. Yes, someone with a very high VO2max (e.g. 70) will be a better runner than someone with a low VO2max (e.g. 30) but discerning the marathon times of two people based on VO2max values in the same ball-park (e.g. 65 and 70) is impossible.
Yes, these Polar- and Garmin-estimated values are within the 95% limits of agreement and, therefore, on a population level can provide a decent estimate of an actual VO2max but, on the individual level, the agreement error ranged from ~6 to ~16 mL/kg/min, which is massive, was poorer for Polar vs. Garmin, and was very poor for men when using the Polar device. Furthermore, validating metrics at baseline does not automatically mean they can detect changes — i.e. there are no studies validating whether a change in actual VO2max is accurately detected by a metric-derived from wearables like Polar V800 and Garmin Forerunner 230.
Athletes typically want to be as precise and accurate as possible to inform their training decisions. Dropping big coin on a device that merely estimates your VO2max is neither accurate nor precise. Use Polar and Garmin devices for what they are intended: accurate and precise measures of your internal (heart rate) and external (pace, time, distance) load. If you want to measure VO2max, do it properly. Or, if you want an estimate, use a calculator (e.g. the Jack Daniels VDOT estimator), which costs zero coin not big coin.
What was the hypothesis or research question?
The authors sought to answer the question, “what is the best type of exercise for post-exercise recovery?” and their aim was to evaluate the effect of two popular modalities of active
recovery (moderate-intensity running and cycling) on markers of exercise-induced muscle damage. No hypothesis was stated.
What did they do to test the hypothesis or answer the research question?
— Using a randomised controlled trial design (without crossover), 30 young male students from the local university completed 1 of 3 interventions: running, cycling, or passive recovery (control) immediately, 24 hours, and 48 hours after a knee extensors muscle damage protocol.
— The muscle damage protocol was performed on an isokinetic dynamometer (Biodex System) and involved a validated protocol: 50 maximal eccentric contractions (5 sets of 10 maximal repetitions, with 30 s rest between sets).
— The running “active recovery” protocol involved a 30 min treadmill run at 60% of treadmill-derived VO2peak and the cycling “active recovery” involved a 30 min cycle ergometer ride at 60% of treadmill-derived VO2peak. The control “passive recovery” group rested on a stretcher for 30-mins.
— Markers of muscle damage were measured at baseline and 24, 48, and 72 hours after the muscle damage protocol.
— Muscle damage markers included self-reported feelings of delayed onset muscle soreness (DOMS), peak torque during a maximal voluntary isometric contraction (MVIC), and blood plasma levels of creatine kinase (CK) and lactate dehydrogenase (LDH).
— Two-way ANOVA was used to compare mean values within interventions and between groups.
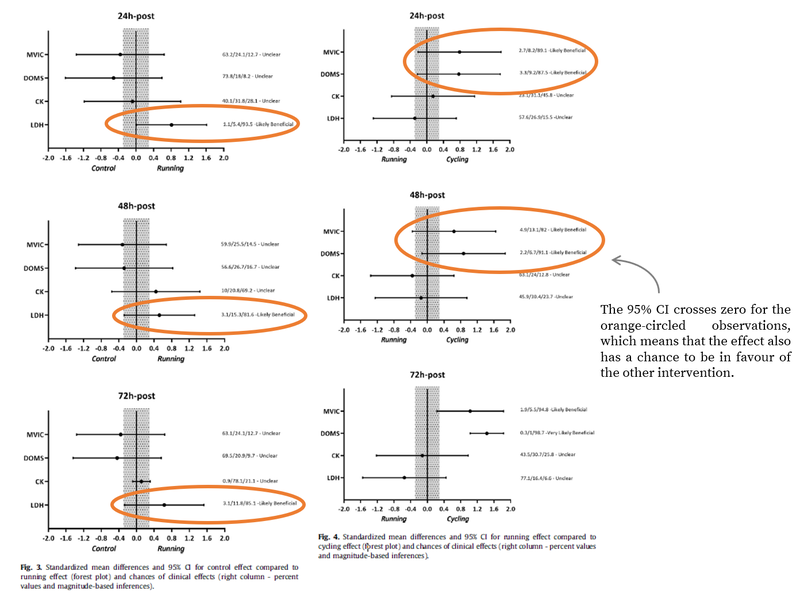
— Absolute changes between baseline vs. post-24 h, post-48 h and post-72 h in each group were used to assess the chances of a possible substantial effect (aka “magnitude based inference”) favorable to either passive (lying down) or active (run or ride) recovery.... i.e. greater than the smallest worthwhile change (calculated as 0.2 ✕ the between-subject standard deviation) in a pairwise analysis.
What did they find?
— There were no between-group differences in subjects’ characteristics suggesting that subjects were well-matched between groups.
— Muscle damage impaired maximal voluntary contraction and increased DOMS in all 3 groups. Surprisingly neither CK or LDH levels were affected by the damage protocol (CK levels were visibly increased so the study was probably underpowered to detect a change, whereas LDH was not visibly affected)
— The impairment in maximal voluntary contraction had not recovered to baseline levels 72-h after muscle damage in all 3 groups.
— DOMS peaked 48-h after muscle damage and had not recovered to baseline by 72-h in all 3 groups.
What were the strengths?
— Power calculations to justify the sample size were described.
—
Effect sizesa quantitative measure of the magnitude of the experimental effect. Less than 0.5 is small, greater than 0.8 is large.
(Cohen’s f) were calculated.
— Subjects were familiarised with making eccentric and isometric contractions on the isokinetic dynamometer used in the muscle damage protocol.
— While it is difficult to blind participants to exercise interventions, at each measurement time point, the researchers were blinded as to the type of intervention performed by each participant.
What were the weaknesses?
—
Effect sizesa quantitative measure of the magnitude of the experimental effect. Less than 0.5 is small, greater than 0.8 is large.
were only calculated for the absolute change between baseline and 48 hours-post muscle damage protocol. The authors cited the reason for doing so was that the peak of muscle damage commonly occurs 48 h after exercise protocols. But, this peak is “on average” and is for some variables of muscle damage (e.g. the feeling of muscle soreness).
— The isokinetic dynamometer is a valid method to cause muscle damage but it has minimal ecological validity. A “real life” muscle damage protocol (e.g. weightlifting, sprinting, or downhill running) would provide more utility in applying the findings.
— Subjects were physically-active but not engaged in regular strength training.
— The two “active recovery” protocols elicited different internal loads: running 30-mins at an average HR of 142±17 bpm vs. cycling 30-mins at an average of 120±30 bpm.
— The 2-way ANOVA found no statistical significance in the between or within trial comparisons, whereas the authors’ magnitude-based inference identified effects of cycling or running vs. passive recovery or cycling vs. running. However, in doing so they ignore that the 95% confidence intervals of the standardized mean difference crosses zero in all the comparisons they call “likely beneficial”. In my opinion, this is highly subjective, and I would not be confident recommending one protocol over another based on these inferences.
Are the findings useful in application to training/coaching practice?
Yes.
This data shows that, in terms of the recovery of feelings of muscle soreness or impaired maximal voluntary contraction after muscle damaging exercise, it doesn’t matter whether you rest for 72-hours or whether you engage in 30-min bouts of moderate-intensity running or cycling for 72-hours. But bear in mind that because the subjects were untrained, these findings may not apply if you are highly-trained and/or engaging in regular strength training. Either way, if you are experiencing muscle soreness and a loss of muscle function for up to 72-hours (or longer) after a previous session then it is not wise to pile on another hard muscle-damaging session just yet.
One last note… Magnitude-based inference can be a useful tool for examining “clinical significance” over “statistical significance” but it can also remove objectivity from, and add subjectivity to, data interpretation. Effect sizes (or standardised mean differences) are very useful for determining the magnitude of an effect but they must always be interpreted with an estimate of confidence, e.g. the 95% confidence interval — the range of values within which the
effect sizea quantitative measure of the magnitude of the experimental effect. Less than 0.5 is small, greater than 0.8 is large.
will fall in 95% of all observations made.
What was the beer called?
Alpha Tier.
Which brewery made it?
Brew Age. Salzburg, Austria.
What type of beer is it?
New England IPA.
How strong is the beer (ABV)?
5.6% ABV.
How would I describe this beer?
A pine-like aroma with a smooth and citrusy feel on the tongue. A “sessionable” flow down the hatch and into the belly with a slightly, but not overpoweringly, hoppy bitter aftertaste. Alpha Tier is nice but it didn’t blow my mind nor did it make me “hop” around looking for more.
What is my Rating of Perceived beer Enjoyment?
RP(be)E(r) = 7 out of 10.
What was the hypothesis or research question?
Recent advances in shoe technology improve running performance significantly for “average” runners both in the lab and in real races. Elite runners also show an improvement of 4% in running performance due to new shoe technology. The authors wanted to see whether finishing times of the best 50 male and 50 female runners have changed pre-carbon plated shoes versus post-carbon plated shoes. Essentially, how much a difference in the faster times of elites might be attributed to technology advancements of shoes.
What did they do to test the hypothesis or answer the research question?
— The authors performed a retrospective observational study of the top 50 finishers at Boston, Chicago, London, and New York City marathons from 2010 - 2019, which included 1505 toal performances, 239 of which were performed in Nike’s with carbon plates (called neoteric Nikes).
— The authors also compared within runner changes for a subgroup of athletes that they had repeated marathon performances in.
— They claim that the use of elite athletes removes many of the differences related to talent or physiology and thus represents a more homogenous sample population.
What did they find?
— Marathon times as a whole were stable from 2010 to 2018, but faster for both men and women in 2019 by ~4 minutes and ~5 minutes respectively.
— In those that ran in neoteric Nikes the men ran 2.8 minutes faster on average and the women ran 4.3 minutes faster.
— In the case control analysis of runners who ran repeated marathons those runners that did not use the neoteric Nikes were not any faster in subsequent marathons, whereas those runners that switched to neoteric Nikes showed a 0.8% increase in performance for males and 1.6% for females. The absolute differences of 3.7 minutes for females was significantly greater than that in males (1.2 minutes).
What were the strengths?
— Elite athletes have pretty similar training and physiology and thus are a homogenous group.
— Validate some of the laboratory collected data from real world observations.
— Case control approach allowed comparisons within the same runner.
What were the weaknesses?
— Data is collected from different courses, different athletes, and under different environmental conditions.
— None Nike shoes that may had similar technology were not differentiated and may not have similar effects
— Did not consider those runners that dropped out and therefore may be biased towards responders.
Are the findings useful in application to training/coaching practice?
I think it’s pretty clear that the new shoe technology improves performance on road marathons. However, there are remaining questions such as whether these carbon plated shoes translate to improved performance on different surfaces like the trails or over longer distances such as ultra marathons. So if you can afford these carbon plated shoes and an extra 1-2% is worth it then you may want to pick up a pair and see how they work for you specifically as there is a long individual variation.
What was the hypothesis or research question?
Heat acclimatization (HAz) is the process of training outside in warm or hot weather conditions to prepare for events in warm or hot conditions whereas heat acclimation (HA) is the process of repeated exposure to a heat stress in a systematic way to improve physiological adaptations. Both HAz and HA have benefits and drawbacks and therefore a combined approach may further increase physiological adaptations important for endurance performance in hot conditions. The researchers hypothesized that a novel HA protocol added to HAz would result in further physiological adaptations in an aerobically trained population.
What did they do to test the hypothesis or answer the research question?
— 25 male distance runners (age 36, VO2max 58 mL/min/kg) performed their normal summer training from May until September on the East Coast of the United States (Connecticut). No training instructions were given during their summer training.
— Measurements were made prior to training in May, immediately after training in September, and then after a 5 day HA protocol. In all instances the runners completed 60 minutes of steady state exercise (59% of VO2max) in hot temperatures (35C, 47% humidity).
— Heart rate, rectal temperature, skin temperature, rating of perceived exertion, thermal sensation, thirst, fatigue, sweat rate and sweat composition were all measured.
— The heat acclimation protocol was in an environmental chamber with a temperature of 38.7C and 51% relative humidity. Subjects exercised at ~70% of VO2max and had to maintain a core temperature above 38.5C for 60 minutes. 5 sessions were completed within a 8 day period.
What did they find?
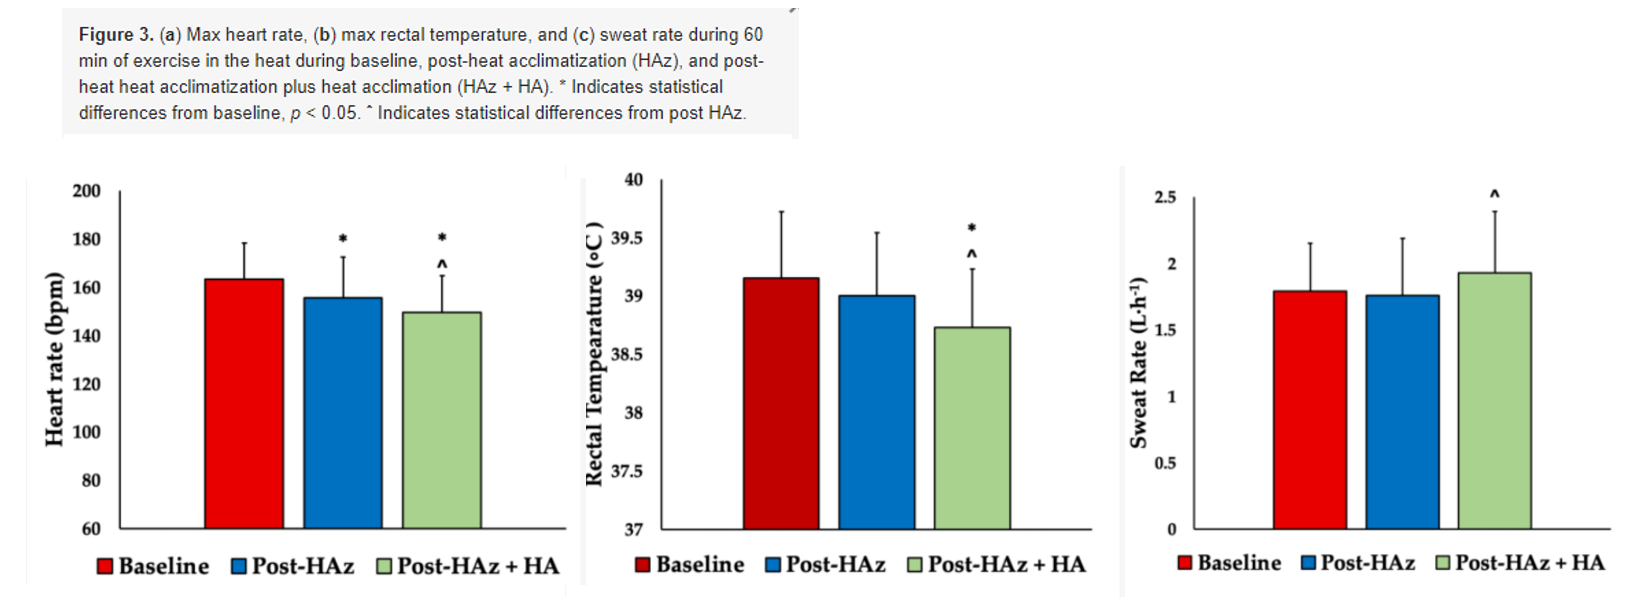
— Heat acclimatization reduced average heart rate during exercise (-5 bpm, ES = 0.36) and skin temperature (-0.45 C, ES = 0.87) and lowered the increase in core temperature (-0.18C, ES = 0.34), but not the absolute changes in core temperature.
— Adding heat acclimation protocol was able to further decrease average heart rate (-4 bpm, ES = 0.29), skin temperature (-0.37C, ES = 0.63) and also reduce core temperature (-0.27, ES = 0.52) and increase sweat rate (0.16 L/h, ES = 0.36).
— RPE, thermal stress, thirst, and fatigue were also less with the addition of the HA protocol to the HAz training over summer. Effect sizes were 0.50 for RPE, 0.72 for thermal stress, and 1.0 for thirst and fatigue.
What were the strengths?
— Combination of a real world approach with a laboratory intervention.
— Solid statistical approach. Power calculations and reporting of effect sizes.
— Used aerobically trained individuals rather than untrained individuals.
What were the weaknesses?
— Even though the HA was effective to properly mimic it you would need to measure core temperature somehow and require an environmental chamber of some sort.
— Trial conditions (30C, 60 minutes submaximal exercise) may not represent actual training/racing conditions for athletes.
— No performance measurement. No control group. No females.
—. Study was done in New England which is more temperate than many other places.
Are the findings useful in application to training/coaching practice?
An additional 4% drop in heart rate due to the HA protocol is significant and useful for athletes competing in hot conditions. If possible it is worth it for athletes to HA after a HAz period of time. Athletes should not be shy about training in heat if they plan on racing in heat. This is particularly relevant for athletes that train in more moderate temperatures. Personally, I will have athletes perform a training run and then spend time immediately after in the sauna if they are unable to exercise in an environmental chamber (none of them can)
What was the hypothesis or research question?
Running economy, or energy expenditure for a given speed, along with lactate threshold and VO2max make up the physiological components important for running performance. Running mechanics and therefore economy change throughout a run and energy generation shifts from distal joints (ankle) to more proxima joints (the knee and hip) which likely is detrimental to running economy. The authors wanted to compare minimal shoes (racing flats) to cushioned shoes with regard to the time course and degree of changes in running mechanics which occur. They hypothesize that the greater demand on the ankle in racing flats would lead to changes in running mechanics faster and to a greater degree compared to the cushioned shoes.
What did they do to test the hypothesis or answer the research question?
— 18 runners (10k best 34 min - 54:30) completed two 10km runs at 95% effort in either a racing flat (Adizero Pro 4, Adidas) or cushioned shoe (Glycerin 10, Brooks).
— The stiffness and cushioning properties of each shoe was tested on a specific machine to evaluate the midsole properties.
— Motion capture data and ground forces were simultaneously measured on the treadmill at 13 different points during the run.
— Different models were used to assess whether changes in mechanics were due to habituation (warming up and familiarization) from 0-2km during the run or due to fatigue as measured from 2 - 10km).
What did they find?
— The racing flat resulted in shorter stride length and higher frequency in the first 2km of the run.
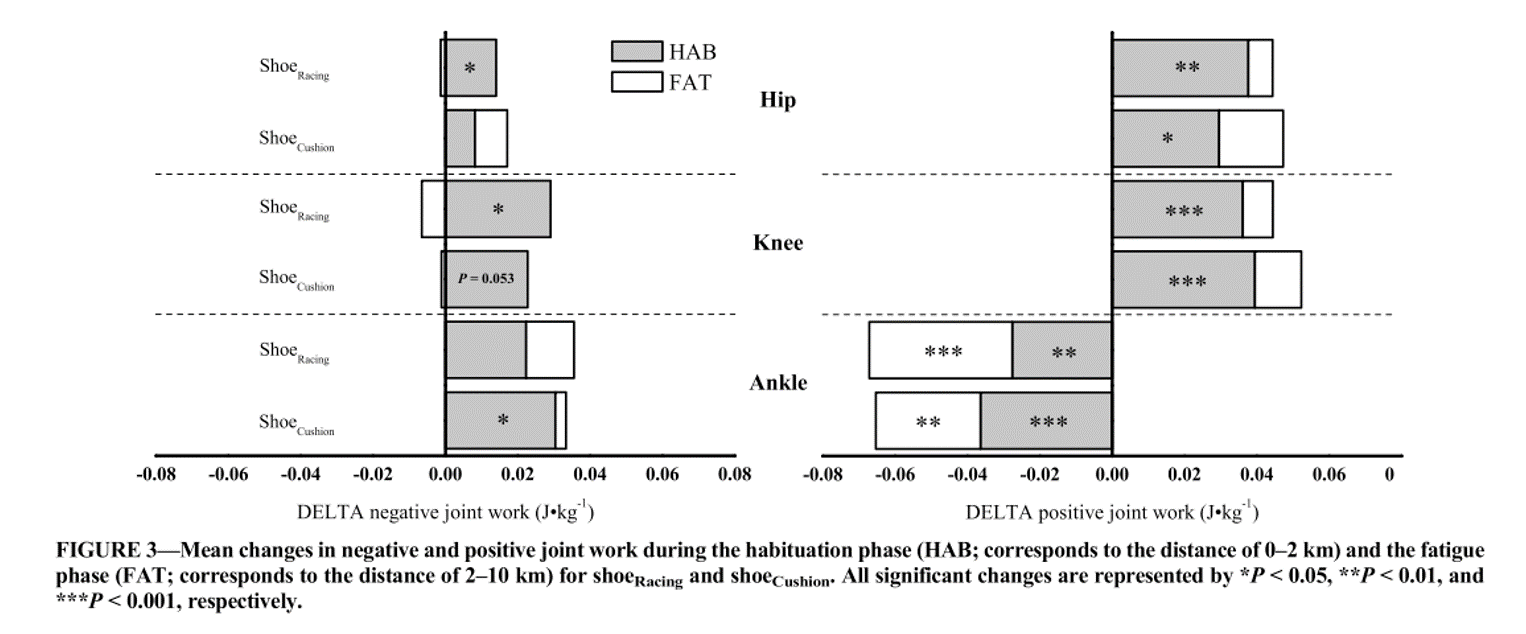
— As expected, mechanically work done in the ankle, knee, and hip all changed during the run, but only within the first 2km for most measures. The effect sizes were small to moderate for most of the changes. There were no differences between the shoes for any of the measures except negative work in the ankle. As you can see in the figure a majority of the changes overall were due to habituation rather than fatigue with fatigue most present in the ankle work done. Differences between shoes were minimal compared to the changes during the 10km run.
What were the strengths?
— Force measures in the treadmill directly
— Force measures were consistent with other studies suggesting valid measurements.
— Mechanical testing of shoe properties to complement the biomechanical analysis.
What were the weaknesses?
— Testing conditions of the shoe properties did not mimic true compression velocities during running.
— Statistical approach led to an increased change of type I errors (false positives).
— Only one model for each type of shoe was used and no mention of how the age/use of the shoe was controlled for between subjects.
— They did not measure running economy, perceived effort, any direct measures of performance, and for only 10km rather than a truly fatiguing effort.
Are the findings useful in application to training/coaching practice?
Not really. We change our form in the first several kms of a run. Not super helpful and probably not very useful. Given that all racing shoes will soon have carbon plates, the lack of that shoe type limits the usefulness of the study.
What was the beer called?
HELM OF AWE
Which brewery made it?
Mad Swede, Boise ID (USA).
What type of beer is it?
ROBUST OATMEAL PORTER
How strong is the beer (ABV)?
6% ABV.
How would I describe this beer?
Smooth drinking Porter that fits in any time of year. It might not be the first thing you reach for on a hot summer afternoon, but it has range with it’s malty finish and subtle hoppy currents. It’s well balanced and smooth. While the name “helm of awe” is a bit of overkill, I certainly think the “helm of daily drinker” would be appropriate. The malt has a little bit of a roast to it, but at 6% it won’t toast you to have a second. Overall, a solid brew that's an enjoyable sipper.
What is my Rating of Perceived beer Enjoyment?
RP(be)E(r) = 7 out of 10.
That is all for this month's nerd alert. We hope to have succeeded in helping you learn a little more about the developments in the world of running science. If not, we hope you enjoyed a nice beer…
Until next month, stay nerdy and keep training smart.
Everyday is a school day.
Empower yourself to train smart.
Think critically. Be informed. Stay educated.
Disclaimer: We occasionally mention brands and products but it is important to know that we are not sponsored by or receiving advertisement royalties from anyone. We have conducted biomedical research for which we have received research money from publicly-funded national research councils and medical charities, and also from private companies. We have also advised private companies on their product developments. These companies had no control over the research design, data analysis, or publication outcomes of our work. Any recommendations we make are, and always will be, based on our own views and opinions shaped by the evidence available. The information we provide is not medical advice. Before making any changes to your habits of daily living based on any information we provide, always ensure it is safe for you to do so and consult your doctor if you are unsure.
If you find value in these nerd-alerts, please help keep them alive and buy us a beer:
If you enjoy this free content, please like and follow @veohtu, @mjlaye and @thomaspjsolomon and share these posts on your social media pages.
About the authors:
Matt and Thomas are both passionate about making science accessible and helping folks meet their fitness and performance goals. They both have PhDs in exercise science, are widely published, have had their own athletic careers, and are both performance coaches alongside their day jobs. Originally from different sides of the Atlantic, their paths first crossed in Copenhagen in 2010 as research scientists at the Centre for Inflammation and Metabolism at Rigshospitalet (Copenhagen University Hospital). After discussing lots of science, spending many a mile pounding the trails, and frequent micro brew pub drinking sessions, they became firm friends. Thomas even got a "buy one get one free" deal out of the friendship, marrying one of Matt's best friends from home after a chance encounter during a training weekend for the CCC in Schwartzwald. Although they are once again separated by the Atlantic, Matt and Thomas meet up about once a year and have weekly video chats about science, running, and beer. This "nerd alert" was created as an outlet for some of the hundreds of scientific papers they read each month.
To read more about the authors, click the buttons:
 and Matt Laye PhD
 What was the hypothesis or research question?