Each month we compile a short-list of recently-published papers (full list here) in the world of running science and break them into bite-sized chunks so you can digest them as food for thought to help optimise your training. To help wash it all down, we even review our favourite beer of the month.
Welcome to this month's installment of our "Nerd Alert". We hope you enjoy it.
Share this nerd alert:
Click the title of each article to "drop-down" the summary.
What was the hypothesis or research question?
Critical speed is the running speed at which the maximal oxidative rate occurs, which demarcates the boundary between the heavy and severe exercise-intensity domains. Therefore, running at speeds below critical speed causes a steady VO2 while speeds faster than critical speed do not — such speeds cause an ever-increasing drift of VO2 towards VO2max.
Knowing critical speed is useful but physiological testing is impractical since it requires multiple bouts to failure.
The authors’ aim was to assess the reproducibility of the speed derived from a 10-min submaximal treadmill test and then compare the speed derived from the 10-min submaximal test to the critical speed derived from a series of three exhaustive exercise bouts.
What did they do to test the hypothesis or answer the research question?
— 42 recreational runners (31 men and 11 women) completed several exercise tests on separate days: an incremental test (to determine VO2max, velocity at VO2max, ventilatory gas exchange threshold), a 10-minute submaximal test (on 3 occasions, a familiarisation, and a test-retest to determine reproducibility), 3 field tests (1200m, 2400m, and 3600m time trials in a randomised order), and 2 constant speed runs (5% slower and 5% faster than the 10-min submax speed test, in a randomised order).
— Critical speed (metres/second) was determined from the slope of the linear regression of the distance ran (metres) versus time (seconds) model.
— The 10-minute submax test was performed at a self-selected hard pace.
— All tests were completed without pace or time feedback and without verbal encouragement, except in the constant speed tests during which participants were encouraged to run for as long as possible.
— Test data were compared using Bland-Altman plots to visualise the difference between tests, and they calculated the coefficient of variability and limits of agreement and calculated intraclass correlation coefficients.
What did they find?
— Test-retest reliability of the 10-minute submaximal test was acceptable.
— Runners completed the 10-minute test at 82% of their vVO2max and 114% of their gas exchange threshold.
— When compared to the standard critical speed determination (the metres per second slope of the distance-time plot derived from the 1200, 2400, and 3600m time trials), the 10-min submax test showed high validity with determination coefficients of r = 0.93 (90% confidence interval: 0.88–0.96), where 1 equals a perfect fit. The standard error of the estimate was small (0.06 metres per second in a cohort in whom critical speed was 3.88 ± 0.55 m/s.
— The speed achieved during the last 5-min of the 10-min submax treadmill test was similar to the CS.
— During the constant speed test at 5% slower than 10-min self-selected pace, participants reached a steady state of VO2, below VO2max. Subjects were asked to stop once they reached 20-mins.
— During the constant speed test at 5% faster than 10-min self-selected pace, VO2 continually rose and participants reached their VO2max within 20-minutes.
What were the strengths?
— Inclusion of a reasonably large cohort.
— Use of appropriate statistical approaches to compare apples with apples (Bland-Altman plot) and clear presentation of standard error, confidence intervals, intraclass correlation coefficients, and limits of agreement.
— Inclusion of critical speed determination using gold standard approach.
— Inclusion of familiarization and test-retest reliability of the new test.
— The validation of the test by conducting 5% below and 5% above tests to ensure that VO2max was not or was reached.
— Transparent reporting of subjects’ data which deviate from normal.
What were the weaknesses?
— Lack of highly-trained athletes and/or elite athletes.
— No statistical justification (power calculations) of the sample size used.
— The self-paced 10-min test is labelled as a “submaximal” test but the instructions provided to participants does not make it clear that it is submaximal; they are simply told to run hard for 10-minutes. This is vague. I know very many highly-trained runners who, if instructed to simply “run hard” for 10-minutes, will push maximally and will hit VO2max within that time.
Are the findings useful in application to training/coaching practice?
Yes.
Knowing an athlete’s critical speed can help prescribe training velocity (on flat terrain) for threshold type sessions. Since measuring critical speed using traditional methods requires at least 3 time trials, it is not practical. Therefore, this 10-min self-paced hard run could be a useful alternative. That said, this paper only validated the model in recreational runners. The findings may not hold true in highly-trained sub-elite or elite runners, especially when considering that an athlete would be highly motivated to push harder during a self-paced 10-minute time-trial when only given the instruction to “run hard for 10-mins”. A top-level runner would easily be able to run at their velocity at VO2max for 10-minutes and reach VO2max.
What was the hypothesis or research question?
Prior work has shown that downhill running can attenuate subsequent eccentric contraction-induced muscle damage and that, during running, fatigue can be partially explained by repetitive low-intensity eccentric contractions-induced muscle damage. It is also known that eccentric exercise-induced muscle damage is associated with a loss of maximal voluntary contraction and a decrease in the rate of torque development of the knee extensors.
In this study, the authors tested the hypothesis that fatigue induced by level running exercise can be attenuated by previous downhill running-induced muscle damage.
What did they do to test the hypothesis or answer the research question?
— Twenty-seven untrained male college students (see group characteristics here) with no prior experience of resistance or endurance training completed a randomised controlled trial in which participants were randomised to one of two groups: control or experimental.
— Both groups ran for 60-minutes at 70% of their velocity at VO2max (i.e. easy effort running for a highly-trained athlete but a mixed bag of intensity for untrained folks).
— Neuromuscular function (maximal voluntary contraction and rate of torque development of the knee extensors, and EMG signal of the vastus lateralis quadriceps muscles) and indirect markers of exercise-induced muscle damage (blood creatine kinase levels and knee extensor muscle soreness via self-palpation) were assessed before, immediately after, and 48-hours after the 60-min run.
— Fourteen days before the 60-minute run, participants in the experimental group performed a 30-min downhill run on a treadmill at —15% grade at 70% vVO2peak. Neuromuscular function and exercise-induced muscle damage were also assessed before, immediately after, and 48-hours after the downhill run. Participants in the control group did not perform a downhill run.
— Between group variables were compared using t-tests, one-way and two-way analysis of variance (ANOVA). Although it is unclear how they controlled for independent sample in the two-way analysis (i.e. it was not the same subjects completing the control and experimental trials but they use a statistic which assumes they were the same folks).
What did they find?
— Knee extension isometric peak torque (maximal voluntary contraction) decreased by 36% immediately following downhill running (effect size = 0.38, aka a small effect) with full recovery reached 48 h post-downhill run.
— Muscle soreness developed immediately after and remained 48-hours after the downhill run (effect sizes not reported) but creatine kinase was unchanged.
— Maximal voluntary contraction decreased about 11% immediately after the 60-min level run (effect size = 0.16, aka a negligible effect) in the control group (those who had not done a downhill run 14-days prior) and remained below baseline values 48-hours after level running. Maximal voluntary contraction was unchanged during level running in the experimental group (i.e. in those who completed a downhill run 14-days prior).
— Muscle soreness increased after level running in both groups but CK did not. Neither muscle soreness or creatine kinase were different between groups.
— Rate of torque development decreased after the 60-min level run (effect size = 0.13, aka a negligible effect) in the control group and remained below baseline values 48-hours after level running. Rate of torque development was unaffected in the experimental group.
— The authors concluded that a single downhill bout can attenuate fatigue caused by level running performed fourteen days later.
What were the strengths?
— Power calcs were used to justify the sample size (although it is not clear if this accounted for subject drop-outs).
— Reporting of effect sizes (eta-squared) to provide the reader with an idea of the magnitude of effects rather than simply how likely they are to occur (P-values_.
— Use of robust methods for measuring isometric peak torque (maximal voluntary contraction) and rate of torque development.
What were the weaknesses?
— The use of untrained subjects with no prior history of resistance or endurance training negates the utility of the findings for trained runners, who will be well-accustomed to eccentric contractions-induced muscle damage.
— Having untrained folks run for 60-minutes is tough and having untrained folks run at 70% of their velocity at VO2max will put some of them in the easy domain (less than the aerobic threshold) and others in the heavy, possibly severe domain (above anaerobic threshold). (Note that in a trained endurance athlete, 70% of vVO2max would most likely be Easy effort).
— Non-crossover design, i.e. participants only completed either the control (no downhill run) or the experimental (downhill run) conditions.
— The authors do not describe what happened in those 14-days days between trials not do they provide any info regarding exercise or diet habits in and around the trials.
— The control group not only did not perform a downhill run but all they did was rest. A more appropriate approach would have been to make the control participants run on a treadmill at no decline for 30-mins 14-days prior to the 60-min run, to match the energy expenditure to the experimental group and to rule out changes in neuromuscular function and soreness.
Are the findings useful in application to training/coaching practice?
No.
Decreasing muscle soreness and the loss of neuromuscular function following a run is a useful goal for an athlete or a nonathlete — this will help an athlete recover before their next session and will help a nonathlete not feel terrible after exercise, thus motivating them to exercise again. But, there are caveats…
First, in line with public health guidelines, untrained folks should aim to be physically active for at least 30-mins a day. Regular exercise — i.e. training — will also help a previously untrained person feel better and recover faster after each exercise bout. It is, therefore, not useful or practical to advocate an untrained doing a downhill bout 14-days prior to a level running bout, thus having 13-days without activity.
Second, this study only included untrained subjects so we cannot extrapolate the findings to trained athletes, who are accustomed to eccentric contractions. (Note that there is some evidence that downhill training can help alleviate similar issues in athletes and many coaches, including Matt and I, prescribe such things to our athletes who do not live in mountainous regions. Plus, strength training and plyometric training can also be used to simulate the eccentricity of downhill running, and both Matt and I also prescribe such things for our athletes.)
What was the hypothesis or research question?
Patellofemoral knee pain is very common, affecting approximately 23% of the general population, and is characterised as pain behind or around the patella typically aggravated by an increased frequency or duration of patellofemoral loaded activities like squatting, running, climbing, and jumping. The authors aimed to evaluate the effectiveness of interventions to reduce the risk of patellofemoral pain.
What did they do to test the hypothesis or answer the research question?
— They completed a systematic review and meta-analysis of randomised controlled trials evaluating the effectiveness of interventions to reduce patellofemoral pain risk compared with a control/non-exposed group in patients with clinical diagnosis for patellofemoral pain.
— They calculated the effect sizes of the interventions as risk ratios and reported the 95% confidence interval.
— They followed PRISMA guidelines and pre-registered the protocol on the PROSPERO database (see protocol here).
What did they find?
— Their initial literature search identified ~6000 potential papers and after aligning them against their inclusion criteria they included 13 RCTs that examined the effect of treatment interventions aimed at reducing patellofemoral pain compared to a control intervention.
— The types of therapy that were compared against a no-treatment control group in the various studies included hip-based and knee-based exercise-therapy, foot orthoses, patellofemoral braces, and gait retraining.
— There is low-quality evidence that wearing a patellofemoral brace during exercise reduces the relative risk of patellofemoral pain by 60% (risk ratio = 0.40, 95% CI 0.22 to 0.73, aka a small effect with a large range of effect).
— There is low-quality evidence that a running retraining programme in novice runners to run softer (i.e., to attenuate landing stiffness) reduces the relative risk of patellofemoral pain by 79% (risk ratio = 0.21, 95%CI 0.07 to 0.60, aka a small effect with a large range of effect).
— A multicomponent exercise-based injury prevention programme may reduce the relative risk of patellofemoral pain by 51% (risk ratio 0.49, 95%CI 0.18 to 1.36, aka a small effect and a massive range of effects) but this was not a statistically significant finding and the quality of evidence was poor.
— Foot orthoses may also reduce the relative risk of patellofemoral pain by 37% (risk ratio 0.63, 95%CI 0.35 to 1.13) but this too was not a statistically significant finding and had a very low certainty of evidence.
— It is important to be aware that the risk ratio is a “relative” risk, i.e. the number of cases with pain in people who are treated vs. the number of cases with pain in people who are not treated. It is not absolute risk, i.e. it is not that same as saying, for example, that a foot orthotic reduces pain by 37%, the data say that foot orthoses reduces the risk of pain by 37% more (on average) than having no orthotic. In others words, it does not mean that not having treatment does not also treat pain. (See the Figure below for an explanation of this with reference to the data in the paper).
What were the strengths?
— Risk of bias (unclear or inadequate: sequence generation, concealment of allocation, blinding, incomplete outcome data addresses, selective outcome reporting, and other biases like funding from organizations that might benefit from the results) in the selected studies was determined by two independent investigators. Disagreements were resolved by a third person.
— Meta-analysis using a random-effects model as between-study heterogeneity was expected due to differences in interventions used and populations being studied.
— Between-study heterogeneity was examined as between-study variation and quantified using the I² statistic.
What were the weaknesses?
— The current literature primarily includes military recruits and young adult athletes so the findings may not be generalisable to other populations.
— The authors reported a low to very low quality of evidence in the available studies, mostly due to the high risk of bias and relatively low number of patellofemoral pain cases.
— None of the available studies evaluated the effect of education on outcomes, i.e. how knowledge of patellofemoral pain and treatment options.
Are the findings useful in application to training/coaching practice?
Yes and No.
You can see that there are many treatment options. You can also see from the Figure below that the risk of pain in the untreated groups is also quite low. The current evidence base does not allow for a meta-analysis to inform an optimal prevention/treatment intervention for patellofemoral knee pain. Given the high risk of bias in the available studies, this is an area that will warrant a future meta-analysis when more RCTs have been completed. It is possible that a future meta-analysis will have a different conclusion to this one when better quality evidence is available.
If you ever have pain, stop and see your doctor and/or qualified sports physiotherapist ASAP. And, help them understand your issue and help nudge them with the various treatment options — no doctor knows everything and they may not be aware of all options. In the case of patellofemoral pain, given the large confidence intervals of the effects, the best option for treatment is the one that works for you. But, also note that this meta-analysis does not indicate that adding together the treatment options creates a super treatment — 1 plus 1 rarely equals 2 when it comes to injury treatment or training approaches.
What was the beer called?
Imperial Chupacabra.
Which brewery made it?
Hop Hooligans (Romania).
What type of beer is it?
Imperial Stout.
How strong is the beer (ABV)?
9.5% ABV.
How would I describe this beer?
A dark, sweet, but not-so-thick beer with a spicy aroma, a chocolatey ginger taste, and an aftertaste hint of chili that leaves a hullabaloo of flavour on the tongue.
What is my Rating of Perceived beer Enjoyment?
RP(be)E(r) = 9 out of 10.
What was the hypothesis or research question?
There are some commonly used markers of exercise training effectiveness. These include mitochondrial enzyme activity, capillary density, and increases in proteins important for exercise adaptation such as PGC-1alpha. The authors wanted to determine whether the changes that we know occur with exercise training are consistent changes within the same person. They wanted to test the idea that endurance training adaptations are repeatable to an identical training period. Previous work from the same study showed dissimilar changes in mRNA expression and cardiorespiratory fitness markers and thus the authors hypothesized that the changes from one training block to the next would be different.
What did they do to test the hypothesis or answer the research question?
— They recruited 10 young males to complete identical 4 week blocks of training with a 3 month period of no training in between.
— The training consisted of 4 high intensity interval sessions per a week. The sessions were 4 x 4 minutes at 90-95% of heart rate max with 3 minutes rest. All training was supervised.
— Muscle biopsies were taken 48-72 hours prior to the training block and following the last training session.
— Markers of endurance training were examined including; citrate synthase activity, PGC-1alpha protein, Oxidative Phosphorylation proteins, and capillary density..
What did they find?
— All markers of training did increase in response to each of the individual training sessions, so the paradigm of training that they used did what they expected.
— However, the increase for each individual was dissimilar between all of the markers of training and they conclude that there is variability in the response to identical training blocks in the same individual. The correlations were all poor to fair and none were significant.
— Previous studies showed that the individual response to a time to fatigue test or VO2max were also dissimilar from one training block to the next.
What were the strengths?
— Effective training protocol combined with an effective wash out phase in which the individuals had sufficiently detrained back to baseline levels.
— Effective training protocol in demonstrating changes in some, but not all, of the variables that they were hoping for.
What were the weaknesses?
— Overall the study had a small n (n=10) and homogenesis population (males, mean age of 22) which limits the external validity.
— For some variables, such as capillary density, there was a very small number of subjects that they had data for (n = 4) for all time points..
— No change in mitochondrial activity marker citrate synthase.
— No accounting for possible measurement errors.
— Really, really, really would have benefited from a no exercise control group, standardized nutrition.
Are the findings useful in application to training/coaching practice?
Yes, the same training will not induce the same response even in the same person. This calls in question the idea of a “high” or “low” responder to an exercise training protocol because of the intraindividual variability for a given training block. The source of this variability remains unknown (genetic? Environment? Measurement error?), but is consistent across markers or training status and performance as well. While this particular study has some flaws the concept that it is attempting to demonstrate is an important one.
What was the hypothesis or research question?
Very similar idea to the last article. Exercise training induces a heterogeneity of responses to the same stimulus. The various contributions of this are unknown. Twins can be used to eliminate the effects of genetics from any changes in responses. In a typical training study 20-30% of the individuals fail to show a positive response to the exercise program. The authors hypothesized that those who had a positive response to one type of exercise would have a positive response to another type (resistance and endurance). The goal of the study was to determine the contributions of genetics and environment to training adaptability to endurance and resistance training.
What did they do to test the hypothesis or answer the research question?
— 34 pairs of twins (24 monozygotic MZ, identical, and 10 dizygotic DZ, fraternal) were selected for the study after screening. They were young (mean age = 24) and relatively healthy, but did not meet the current Australian guidelines for exercise of 150 minutes per a week.
— Subjects were randomized to either a 3 month endurance exercise protocol or 3 month resistance exercise protocol (each had 3 x 1 hour session per a week for 12 weeks). Each protocol used an overload principle and adjusted the exercise as individuals improved. The training period was followed by a 3 month wash-out and then the groups switched exercise modalities.
— The primary outcomes of the endurance protocol were VO2max and time to exhaustion. The primary outcomes for the resistance protocol were one repetition max of leg press and bench press.
What did they find?
—When performing endurance training VO2max increased, when performing the resistance training one repetition max increased, while the improvements in the modalities not training for were far less. Overall 100% of the subjects improved leg press max in response to strength training and 86% of subjects improved VO2max in response to endurance training.
— 50% of the individuals improved in both leg press exercise (1 RM) and endurance exercise (VO2max) and 50% of the individuals improved leg press exercise (1 RM) BUT not endurance exercise (VO2max). Overall there were no “non-responders” to the increased 1 RM of leg press in response to resistance training. From endurance training 47% of individuals improved in both VO2max and leg press 1 RM, while 49% improved in just VO2max (39%) or just 1 RM (10%) and 4% improved in neither.
— The increased VO2max to endurance training did not correlate with the increase in 1 RM in response to strength training suggesting that a high responder to one type of exercise is not necessarily a high responder to another.
— Baseline strength and endurance are highly heritable with most of the contribution due to a shared environment, which agrees with other studies.
— In response to endurance training MZ twins demonstrated a heritability effect of changes in VO2max, and a small effect on 1 RM leg press. In response to resistance training MZ demonstrated a heritability effect of changes in 1 RM leg press and but no heritability effect on VO2max improvement.
— Overall baseline characteristics are more heritibile than the changes in response to training which are more dependent upon the environment.
What were the strengths?
— Randomized cross over design that included both MZ and DZ twins.
— Demonstrations of specificity of improvements to either endurance or resistance training.
— Ability to detect genetic contributions to the changes in response to training rather than just baseline characteristics.
— Verified genetic status of MZ and DZ twins with testing
What were the weaknesses?
— In the modeling of twin studies and the various contributions of genetics and environment there is an assumption that the environment is “shared” between MZ and DZ twins equally.
— Low number of DZ twins.
— End points are not necessarily correlated with performance as well as other measures.
— Specific to a younger population.
Are the findings useful in application to training/coaching practice?
Yes. The effects of genetics in response to training are less than the effects when looking at baseline characteristics. If an athlete is not seeing an improvement due to one type of training then shifting from endurance focused to more resistance type exercise may be beneficial and may increase endurance as well. Regardless, it is important to track improvements in fitness of all kinds to ensure the training stress is leading to improvements.
What was the hypothesis or research question?
This is a review article that is focused on what to eat prior to exercise and how that can influence metabolic, physiological, and performance responses to the subsequent exercise bout. Much of the confusion about what to eat prior to exercise is because of some studies that show carbohydrates ingested prior to exercise may blunt some of the physiological adaptations to exercise in general and with regards to fat metabolism specifically. However, much of the data is mixed; positive, negative, or no effect. This review attempts to analyze all of the studies together for some observations and summarizes findings with less consistent data elsewhere.
What did they do to test the hypothesis or answer the research question?
— Compared the effects of various nutritional interventions prior to exercise on how metabolism and physiological responses changed during exercise.
— Used 125 studies with a total of 1245 subjects for their analysis of exercise duration, feeding amount, and exercise intensity. Compared the relative use of different substrates (fats versus carbs) and cell signalling.
— Grouped studies by whether they compared fasting to not-fasting or various muscle glycogen manipulations.
— Identified areas for future research.
What did they find?
— As exercise duration increases the utilization of fat for energy increases in both fasted and non-fasted subjects, but is consistently lower in the fasted group. Low versus high muscle glycogen results in an initial large difference in respiratory exchange ratio, but narrows with increasing duration of exercise.
— There is a strong correlation between (low) starting muscle glycogen levels and fat utilization during exercise (a lower respiratory exchange ratio) as indicated in the following figure.
— As exercise intensity increases the difference in respiratory exchange ratio decreases and the effect of fasting is limited. However, regardless of exercise intensity when exercise begins in a state of low muscle glycogen then respiratory exchange ratio continues to indicate a higher use of fat utilization (see Panels A and C in the figure below).
— A weak relationship was found between the amount of carbohydrates consumed. Any carbohydrate consumed in the 4 hours prior to exercise has a similar effect on changing substrate utilization.
— No real effect of consuming a small amount of carbohydrates (less than 75g) seemed to alter cell signaling (AMPK, MAPK, mTOR, SIRT, or others) in a predictable manner based on starting nutrient levels.
— Exercising in the fed state is beneficial (within 90 minutes of exercise), but there is little difference based on the amounts of carbohydrates consumed prior to exercise.
— Both markers of endurance such as mitochondrial density or fat oxidation capacity and time trial performances tend to improve more when training is done in the fasted state or low muscle glycogen state.
What were the strengths?
— Large number of studies looked at to compile some of the data.
What were the weaknesses?
— Mostly applicable to a population of moderately trained males (87% of the study populations) and very few females in the studies.
— Very few training studies looking at long term adaptations and of the ones exist there are many different approaches used to modify glycogen levels.
— No discussion of the use of fat in meals prior to exercise.
Are the findings useful in application to training/coaching practice?
Yes. The strongest evidence found was that exercising with low muscle glycogen enhances the utilization of fat, muscle biochemical markers of endurance, and some time trial performances. Periodization of carbohydrate intake seems like a practical strategy to try to improve endurance capacity. Specifically one should match the duration and intensity of exercise with the pre-meal carbohydrate content. High intensity training benefits from pre-exercise carbohydrate intake, whereas prior to low intensity steady state it may be appropriate to withhold carbohydrate intake.
What was the beer called?
Imperial Beer Sleuth with Cake Spice
Which brewery made it?
Bombastic Brewing
What type of beer is it?
Imperial Porter
How strong is the beer (ABV)?
11 % ABV.
How would I describe this beer?
Starts off spicy with a nice winter beer profile. Smooth with a nice head. Flavors of cloves, cinnamon. The 11% really catches up to you by the end of the can and it finishes a bit boozy.
What is my Rating of Perceived beer Enjoyment?
RP(be)E(r) = 8 out of 10.
That is all for this month's nerd alert. We hope to have succeeded in helping you learn a little more about the developments in the world of running science. If not, we hope you enjoyed a nice beer…
Until next month, keep active, stay nerdy, and train smart.
Everyday is a school day.
Empower yourself to train smart.
Think critically. Be informed. Stay educated.
Disclaimer: Any interpretations and recommendations we make are, and always will be, based on our own views and opinions shaped by the evidence available to us. Before making any changes to your training based on any information we provide, always ensure it is safe for you to do so and consult your doctor if you are unsure.
If you find value in these nerd-alerts, please help keep them alive and buy us a beer:
If you enjoy this free content, please like and follow @veohtu, @mjlaye and @thomaspjsolomon and share these posts on your social media pages.
About the authors:
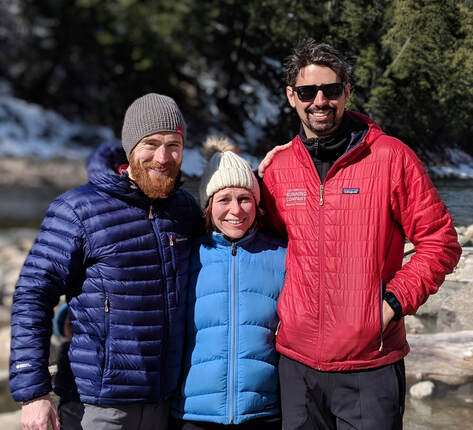
Matt and Thomas are both passionate about making science accessible and helping folks meet their fitness and performance goals. They both have PhDs in exercise science, are widely published, have had their own athletic careers, and are both performance coaches alongside their day jobs. Originally from different sides of the Atlantic, their paths first crossed in Copenhagen in 2010 as research scientists at the Centre for Inflammation and Metabolism at Rigshospitalet (Copenhagen University Hospital). After discussing lots of science, spending many a mile pounding the trails, and frequent micro brew pub drinking sessions, they became firm friends. Thomas even got a "buy one get one free" deal out of the friendship, marrying one of Matt's best friends from home after a chance encounter during a training weekend for the CCC in Schwartzwald. Although they are once again separated by the Atlantic, Matt and Thomas meet up about once a year and have weekly video chats about science, running, and beer. This "nerd alert" was created as an outlet for some of the hundreds of scientific papers they read each month.
To read more about the authors, click the buttons:
 and Matt Laye PhD
 What was the hypothesis or research question?
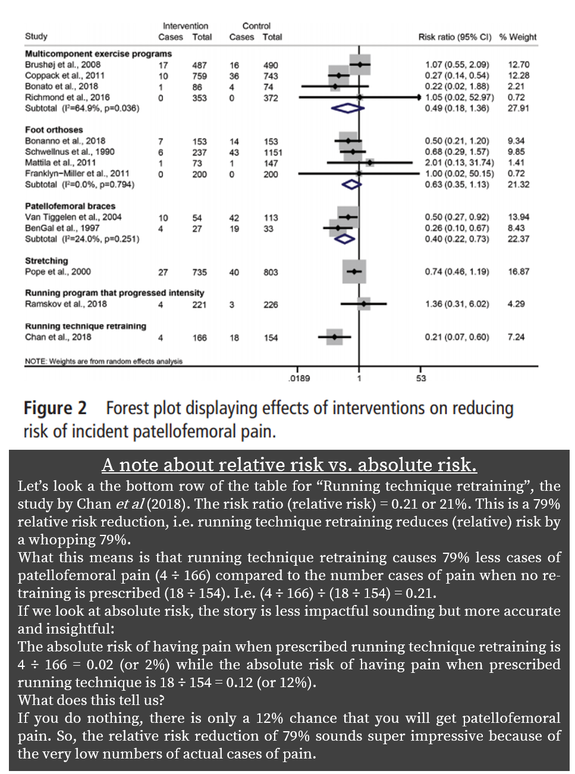

 — There is a strong correlation between (low) starting muscle glycogen levels and fat utilization during exercise (a lower respiratory exchange ratio) as indicated in the following figure.
  — As exercise intensity increases the difference in respiratory exchange ratio decreases and the effect of fasting is limited. However, regardless of exercise intensity when exercise begins in a state of low muscle glycogen then respiratory exchange ratio continues to indicate a higher use of fat utilization (see Panels A and C in the figure below).
  — A weak relationship was found between the amount of carbohydrates consumed. Any carbohydrate consumed in the 4 hours prior to exercise has a similar effect on changing substrate utilization.
  — No discussion of the use of fat in meals prior to exercise.