Each month we compile a short-list of recently-published papers (full list here) in the world of running science and break them into bite-sized chunks so you can digest them as food for thought to help optimise your training. To help wash it all down, we even review our favourite beer of the month.
Welcome to this month's instalment of our “Nerd Alert”. We hope you enjoy it.
Please retweet or share this nerd alert with anyone who will find it educational:
Click the title of each article to "drop-down" the summary.
What was the hypothesis or research question?
Folks often perform aerobic and strength training simultaneously but their compatibility is unclear. The authors systematically reviewed current evidence to determine the effect of concurrent aerobic and strength training vs. strength training alone on maximal strength, power, and muscle mass (hypertrophy).
What did they do to test the hypothesis or answer the research question?
— The authors did a systematic literature search of several databases (PubMed/MEDLINE, ISI Web of Science, Embase, CINAHL, SPORTDiscus, and Scopus) using PRISMA (Preferred Reporting Items for Systematic Reviews and Meta-Analyses) guidelines.
— Their “PICO” inclusion criteria included:
→ Population: healthy adults of any sex and age;
→ Intervention: supervised concurrent aerobic and strength training for at least 4 weeks;
→ Comparison: identical strength training prescription, with no aerobic training;
→ Outcome: maximal strength, explosive strength, and muscle hypertrophy.
— Methodological quality was assessed using the PEDro scale.
— Maximal strength measures included dynamic bilateral leg press, squat, unilateral isometric torque (knee extension), and bilateral dynamic knee extension.
— Explosive strength measures included jump height and other measures of rapid force production as well as squat jump power and leg press power at 50% of maximal strength.
— Muscle hypertrophy measures included whole-muscle cross-sectional area of the quadriceps femoris muscles (i.e. panoramic ultrasound, CT, MRI), muscle thickness of the vastus lateralis, and segmental DXA of the lower extremities.
— A random effects meta-analysis was used to quantify the overall effect sizes.
What did they find?
— The search identified 15,729 potential articles. After screening and eligibility assessment, 43 studies were included. The meta-analysis included 1090 participants, of whom 590 performed supervised combined aerobic and strength training and 500 performed strength training alone. Cycling was the most common type of aerobic training (24 studies), followed by running (16 studies). Funnel plots did not reveal publication bias towards only positive studies being published (data in supplemental figure file).
— The effect sizes (calculated as standardised mean differences, aka SMD) for concurrent vs. strength alone were:
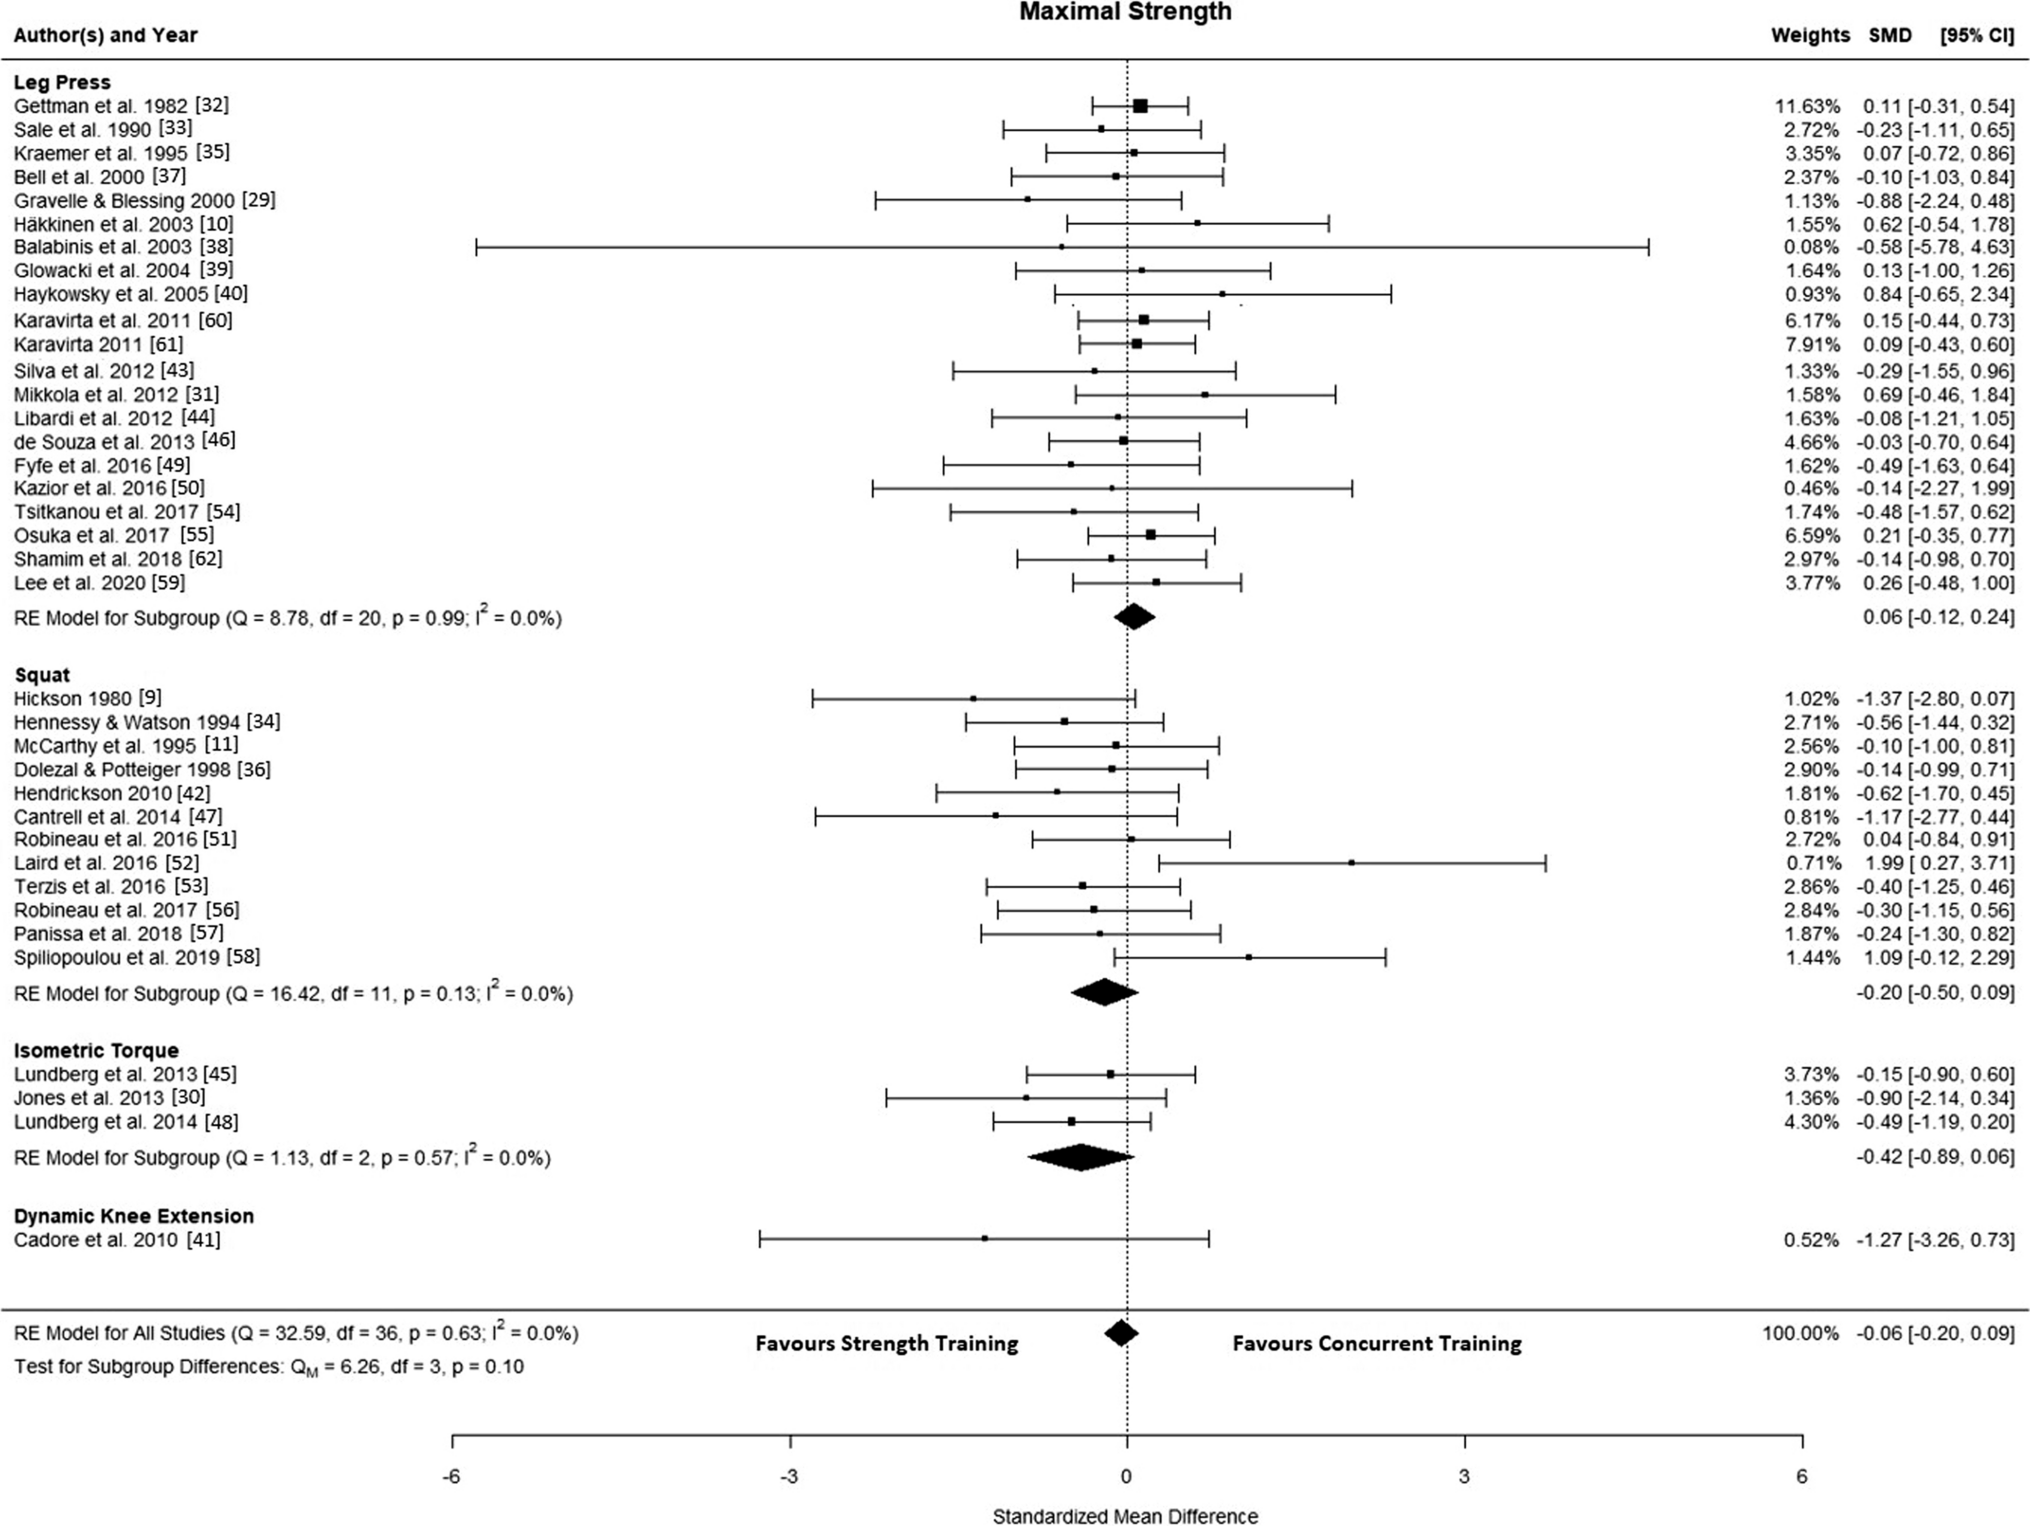
Forest plot of studies comparing differences in maximal strength. CI confidence interval, RE random effects, SMD standardised mean difference. (Open Access article licensed under a Creative Commons Attribution 4.0 International License.)
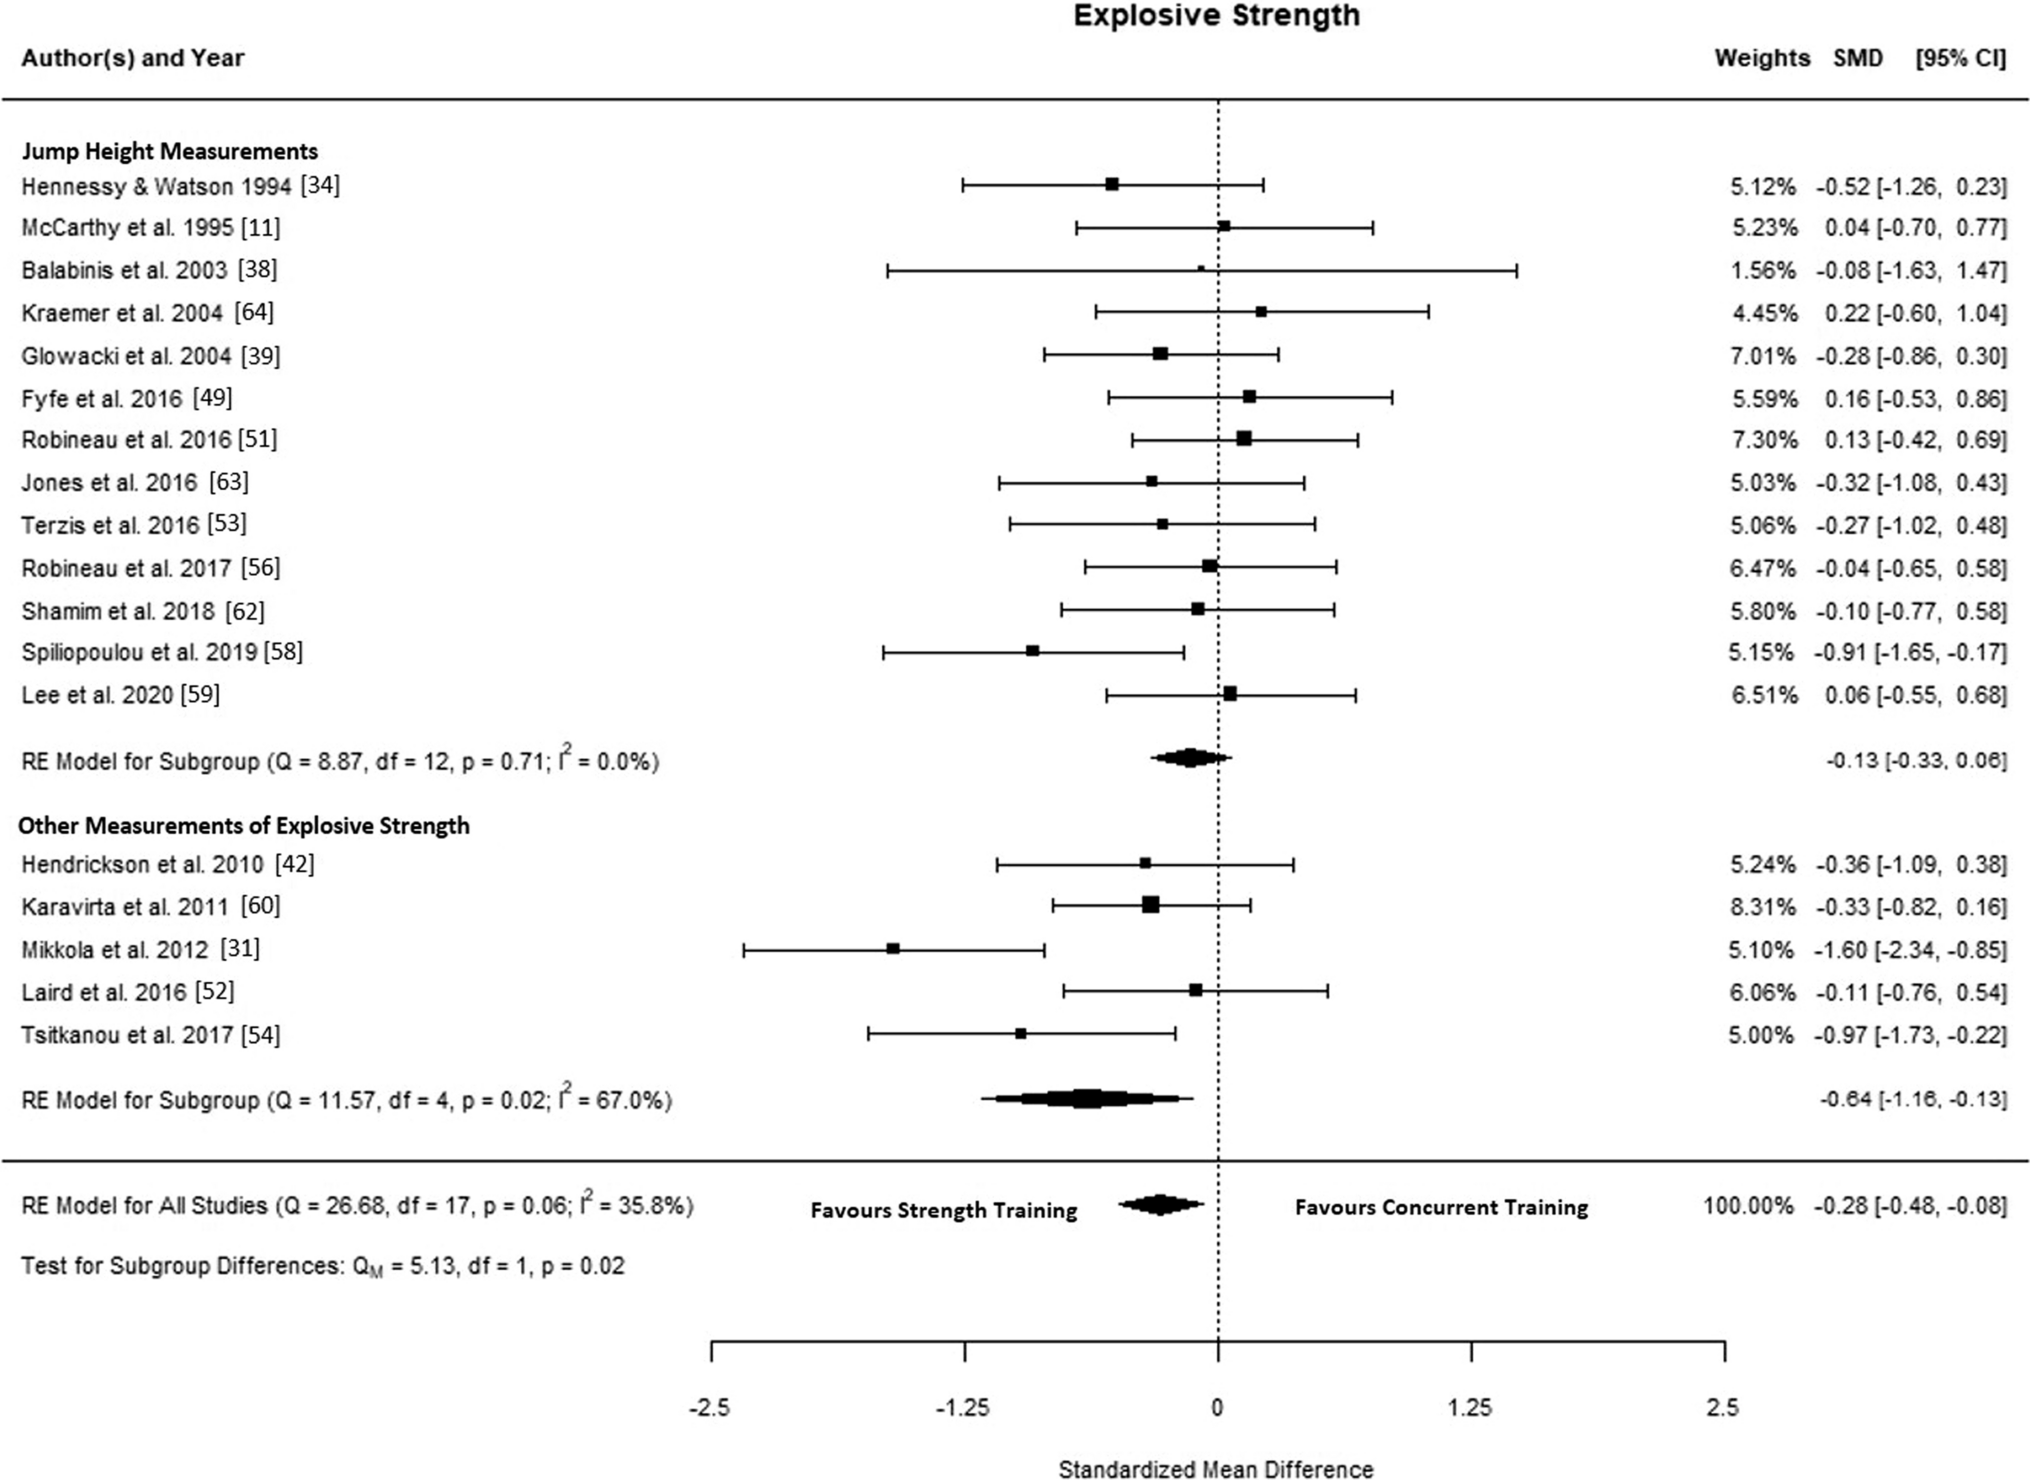
Muscle power → -0.28 (95% CI -0.48 to -0.08; P=0.007) = a small effect,
Forest plot of studies comparing differences in explosive strength. CI confidence interval, RE random effects, SMD standardised mean difference. (Open Access article licensed under a Creative Commons Attribution 4.0 International License.)
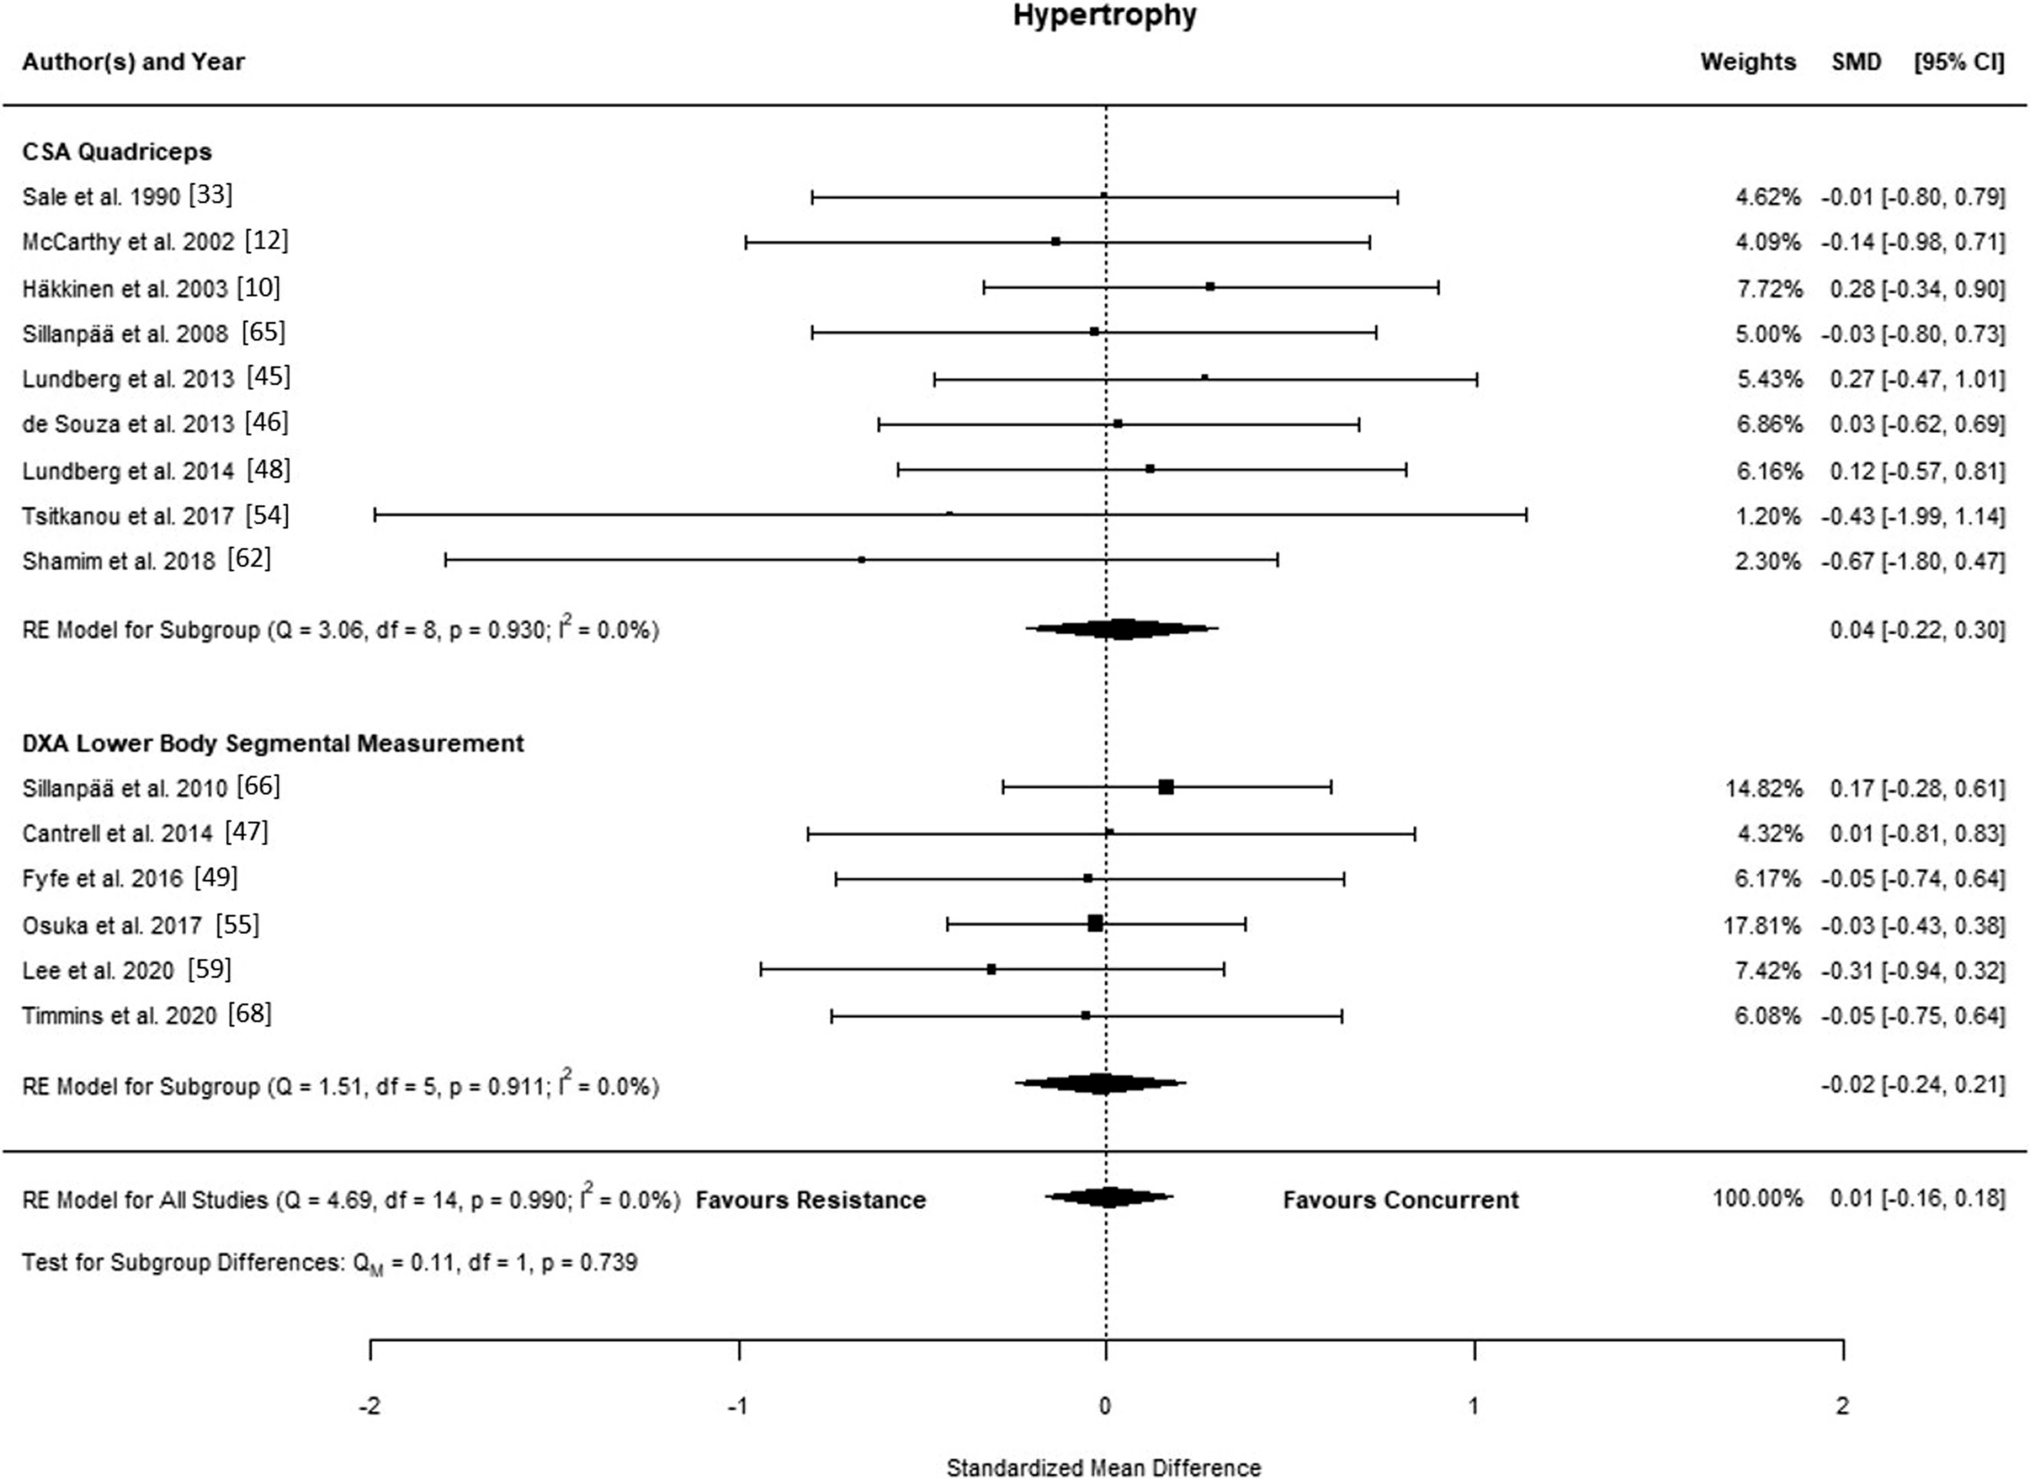
Muscle mass → -0.01 (95% CI -0.16 to 0.18; P=0.919) = no effect.
Forest plot of studies comparing differences in muscle hypertrophy. CI confidence interval, CSA cross-sectional area, DXA dual energy X-ray absorptiometry, RE random effects, SMD standardised mean difference. (Open Access article licensed under a Creative Commons Attribution 4.0 International License.)
— Subgroup analysis showed that attenuation of muscle power (explosive strength) was more pronounced when concurrent training was performed within the same session (less than 20-mins apart; effect size = -0.31; 95% CI -0.62 to -0.01; P=0.043; a small effect) vs. when sessions were separated by more than 3-hours (effect size = 0.08, 95%CI -0.25 to 0.42, P=0.948; no effect). (data in supplemental figure file)
— The effects were not influenced by the type of aerobic training (cycling vs. running), frequency of concurrent training (more than 5 vs. less than 5 weekly sessions), training status (untrained vs. active), mean age (more than 40 vs. less than 40 years), or training modality (same session vs. same day vs. different day training).
— The authors concluded that concurrent aerobic and strength training does not interfere with adaptations in maximal strength or muscle hypertrophy but that concurrent aerobic and strength training may attenuate gains in explosive strength (muscular power), particularly when aerobic and strength training are performed within the same session.
What were the strengths?
— Data extraction was performed independently by two authors and clear standardised approaches were used in the evidence synthesis and data analysis.
— Broad inclusion of male and female athletes and nonathletes of all ages.
— Asks and answers a relevant question.
— Is an “updated” systematic review and meta-analysis, which is the way systematic reviews and meta-analyses are supposed to work; effect size estimates get “updated” as more evidence from randomised controlled trials accumulates.
What were the weaknesses?
— The overall quality of evidence was rated as medium. Of the 43 included studies, 7 were of low quality. Another important point was that the response rate was low when the authors reached out to study authors for additional study details.
— Due to a lack of research, within the “aerobic exercise” category it is not possible to separate steady/easy aerobic runs from threshold runs or interval sessions. Therefore, whether combining a harder run effort with a strength session may impair strength and hypertrophy as well as power is unknown at this time.
Are the findings useful in application to training/coaching practice?
Yes.
Before worrying about the potential “interference” effect of concurrent training, first always remember that the health benefits of doing exercise outweigh the health benefits of not doing exercise — if you only have time to do aerobic and strength in the same session then do them in the same session. That said, if you are a competitive athlete, your goal is different — you are trying to eke out the best you can be, so you need to consider the purpose and the goal of each session…
This meta-analysis shows that trained folks have the same “interference effect” on power as untrained folks — athletes are not immune. So, if the session goal is to build explosive power, then it is probably best not to combine an arduous run with explosive lifting/jumping in the same session. According to this meta-analysis, aim to separate the two by more than 3-hours for maximal benefit.
As a runner, always remember that if your legs are tired you will very likely not be able to produce peak power and, therefore, a power-specific session should be delayed until you feel ready to give it large.
What is my Rating of Perceived Scientific Enjoyment?
RP(s)E = 8 out of 10.
What was the hypothesis or research question?
Many approaches are used to help maximise the beneficial effect of exercise. This study aimed to determine whether the “add-on placebo effect” can augment the psychological and physiological benefits of exercise. Specifically, the primary aim was to quantify the effect of the “add-on placebo effect” on psychological affect (a person’s emotions, feelings, or mood caused by the intervention), self-esteem, rating of perceived exertion (RPE), blood pressure, and cardiorespiratory fitness (V̇O2max).
What did they do to test the hypothesis or answer the research question?
— The authors conducted a systematic review in line with the PRISMA guidelines, searching several databases (including Web of Science, PsycINFO, Psychology and Behavioural Sciences Collection, APA-
PsycARTICLES, ProQuest, CNKI, and WANFANG DATA).
— Their inclusion criteria included:
→ Studies evaluating one or more of the outcome variables of interest (affect, self-esteem, RPE, blood pressure, and V̇O2max),
→ Studies with a control condition (exercise alone), and
→ Studies in peer-reviewed journal papers or master's or doctoral dissertations.
— Their exclusion criteria included:
→ Studies including athletes in competitive sports,
→ Studies including people with clinical symptoms or conditions such as osteoarthritis.
— Study quality was rated using the Cochrane Collaboration tool.
— The effect size of the “placebo effect” was determined as the “exercise + placebo” vs. “exercise alone” and calculated with Hedges' g according to post-test means or pre- and post-test means and standard deviations. The weighted effects were meta-analysed using a random effects model.
— The placebo effect was defined as positive information about exercise and the “add-on placebo” group consisted of those subjected to any specific exercise task and receiving information to induce positive expectations before engaging in exercise (exercise + placebo).
— Heterogeneity analysis was used to determine which outcome of interest (affect, self-esteem, RPE, blood pressure, or V̇O2max) may have variable effects and then meta-regression analysis was used to determine what may explain that variability.
What did they find?
— The inclusion criteria were met by 18 studies with 1,221 participants.
— Publication bias was assessed using a Funnel plot and relieved potential bias in favour of only positive findings being published for V̇O2max and blood pressure.
— The meta-analysis showed that the “add-on placebo effect” had small to moderate beneficial effects for affect (g = 0.430, 95% confidence interval 0.307 to 0.553), self-esteem (g = 0.454, 95% CI 0.227 to 0.681), RPE (g = 0.476, 95% CI 0.264 to 0.688), VO2max (g = 0.273, 95% CI 0.128 to 0.419), and blood pressure (g = 0.268, 95% CI 0.130, 0.406).
— Heterogeneity analysis showed that affect (i.e. subjects’ emotions, feelings, or mood caused by the intervention) had significantly variable outcomes. The subsequent meta-regression showed that the “add-on placebo effect” was enhanced when the likely benefit of the effect was elaborated, when running was the mode of exercise, and when moderate-intensity exercise was used.
— The authors concluded that, during exercise interventions, add-on placebo effects for psychological outcomes are moderate and small for physiological outcomes.
What were the strengths?
— Asking a relevant question.
What were the weaknesses?
— The authors poorly defined the PICO (Population, Intervention, Comparison, Outcomes).
— Funnels plots of publication bias and forest plots of effect sizes were not reported in the main paper, only in the online supplemental files — this is poor practice since these are essential items for interpreting the primary outcomes.
— The quality of the included studies was low, specifically due to a lack of random sequence generation and participant blinding procedures.
— The specific exercise interventions (durations, intensity, time, etc etc) were not clearly described.
— The details of the placebo were not described.
Are the findings useful in application to training/coaching practice?
No.
The placebo effect is a very real thing. While using the placebo effect can be an asset to an athlete or someone using exercise for healthy benefits and while this analysis finds a small to moderate effect of the placebo effect on psychological and physiological outcomes following training, athletes were excluded from the analysis and the complete lack of methodological details about the interventions makes it almost impossible to apply the findings tangibly.
What is my Rating of Perceived Scientific Enjoyment?
RP(s)E = 3 out of 10.
What was the hypothesis or research question?
Sodium supplements are commonly used during ultra and other endurance events based on the observation that salt appears in the sweat. However, previous work has demonstrated that sodium intake is not correlated with plasma levels of sodium and therefore supplements are not recommended and yet endurance athletes continue to use sodium supplements. This study used a larger sample size than previous studies to re-examine the hypothesis that sodium would NOT have an effect on performance even when normalized for body weight.
What did they do to test the hypothesis or answer the research question?
— The authors conducted a prospective observational study during the 5th stage of a 6 stage 250 km long ultra in Chile. All athletes were given their water and carried their food (~2000 kcal) and gear. This study was part of additional measurements taken during the 2017 version of the race and not the specific research question of interest.
— Body weight was measured before and after the stage and plasma concentrations of sodium, urea nitrogen, and creatinine were measured at the race finish line.
— Sodium intake (mg/kg/hour) was calculated as total self-reported sodium intake (mg) divided by time (hours) and normalized by bodyweight (kg), an important consideration not accounted for in all studies. Subjects were stratified into low, moderate, or high sodium consumptions (⅓ in each group).
— Performance, plasma sodium levels, and dehydration levels were compared between the groups consuming different amounts of sodium.
What did they find?
— The lowest ⅓ of sodium consumers took on average 135 mg/h of sodium (2g total), the middle ⅓ 266 mg/hr (4g total) and the highest took ⅓ 577 mg/hr (8g). They found no association between sodium intake and plasma sodium, diagnosis with hyponatremia, weight, hydration status, or finishing rank in the 158 runners that they collected data on.
— When the authors then compared the sodium intake by finishing position they also….wait for it….found no beneficial effects of sodium intake or differences in degree in plasma sodium.
— Interestingly when looking at race position characteristics, those who were MOST dehydrated had a significantly faster result. This is probably because they were moving the fastest, creating the most heat, and sweating the most. This is a finding seen in other studies as well.
What were the strengths?
— Ecologically valid study with a relatively large n.
— Stratified by both sodium intake and by finishing position and had consistent null results regardless of the approach.
— Did not have differences in training volume or experience between the sodium groups.
What were the weaknesses?
— Exact amount of sodium was not measured.
— Did not collect data on some parameters that may alter performance, such as injuries.
— While stratification makes the statistics easier, it is a bit more of an issue when it comes to whether the absolute amounts were consistent with other findings.
— No measures of dietary salt, sodium sweat rate.
Are the findings useful in application to training/coaching practice?
Yes.
Please athletes do not use excessive salt supplementation. There is no performance or health benefit and it may lead to you drinking excessively (hello salty foods plus drinks). Is the nail finally in this coffin? I hope so, but I also imagine I will continue to need to remind my athletes that drinking to thirst and running fast (enough to get dehydrated) is the way to go?
What is my Rating of Perceived Scientific Enjoyment?
RP(s)E = 6 out of 10.
What was the hypothesis or research question?
Running injuries are very common and often have a gradual onset to them with no clear single cause. The acute:chronic workload (ACWR) is a measure that looks at workload over time and allows for a gradual increase in workload and fitness. The authors wanted to examine whether the ACWR was correlated with running related injuries.
What did they do to test the hypothesis or answer the research question?
— This study was a secondary analysis combining 3 different trials in recreational runners free of injury living in the Netherlands.
— All of the data was collected via an online survey. After an initial baseline survey the runners received a survey every two weeks that asked four questions: “(1) the extent to which a health problem affected running participation; (2) running volume; (3) running performance; and, (4) the extent to which the participant experienced health symptoms during the previous 2 weeks.”
— A running related injury was defined as an injury caused by running that prevented a runner from completing 3 or more consecutive training sessions.
— Running duration and volume were used to calculate the ACWR. Acute stress was the last two weeks of data, whereas chronic workload was either from the past 4, 6, 8, 10, or 12 weeks. ACWR was calculated as either coupled (the chronic workload includes the acute), uncoupled (the chronic workload does not include the acute), or using an exponentially weighted moving average (which shows less effect for older workouts compared to more recent ones) for each of those chronic workloads. This resulted in either duration/volume, 5 different lengths of time, and 3 different methods to calculate ACWR. Models were adjusted for BMI, previous injuries, age, sex and running experience.
What did they find?
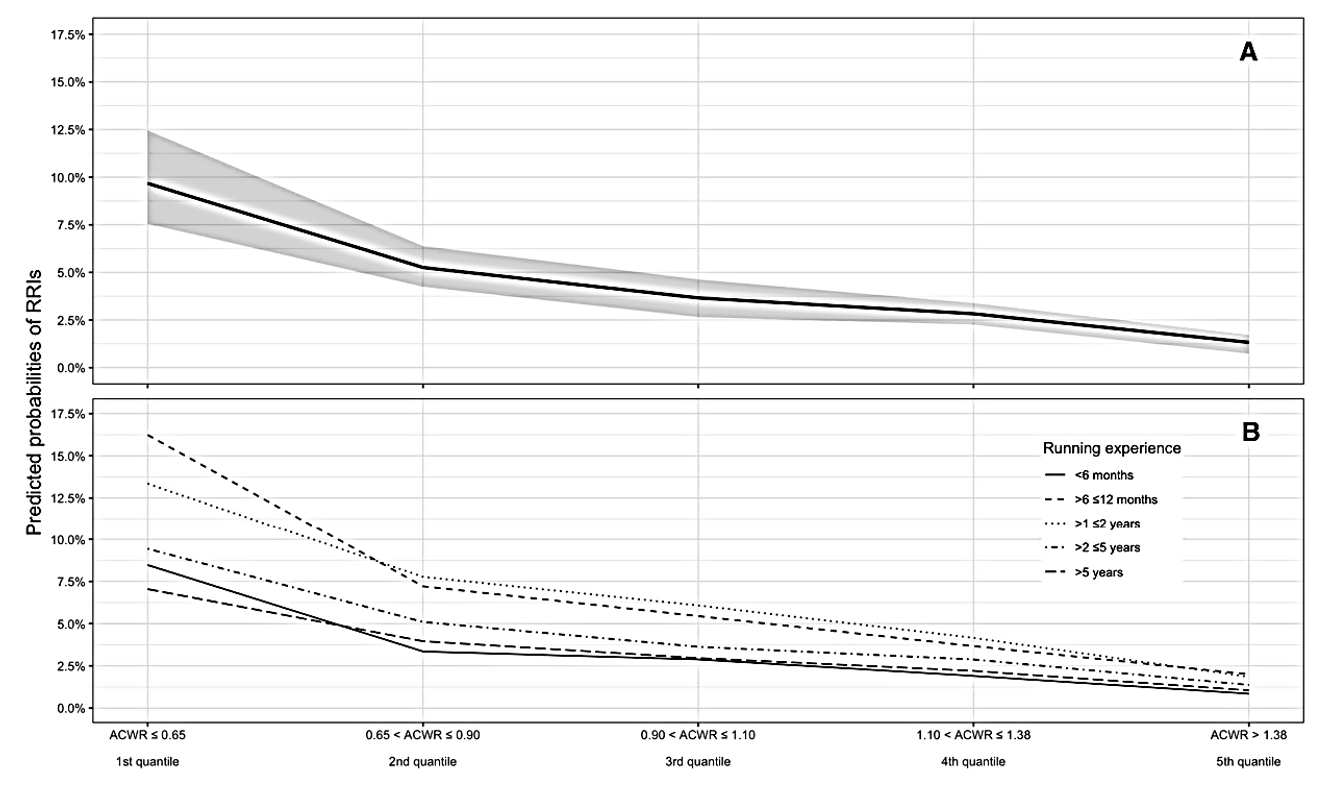
— When looking at all of their models the general trend was an “L-shaped” curve with higher risk of injury associated with a lower ACWR. This is the opposite to what many people would think (most would think increased acute workload relative to chronic workload would be associated with injuries).
Predicted probabilities of sustaining running-related injuries (RRIs). Running workload in hours was used in the uncoupled acute:chronic workload ratio (ACWR) calculation at 8 weeks. Panel A displays the predicted probabilities for all runners (the shaded area represents the uncertainty by displaying the 95% credible interval around the mean estimate). Panel B displays the predicted probabilities for runners within strata of running experience.
— Very few runners varied their current training block by more than 50% with less than 20% of all runners reporting either an ACWR of under 0.5 or over 1.5 (in the coupled approach), 30% in the uncoupled approach, and only 4.5% in the weighted average approach.
— The Bayesian statistical approach to predict injuries showed about 10% risk of injury in the coupled models for the lowest ACWR (less than 0.7). On the other hand less than a 2% of injury risk was predicted with ACWR was greater than 1.3.
What were the strengths?
— Repeated measurements from the same runners.
— Valid for recreational runners.
What were the weaknesses?
— No measures of internal workload (RPE or HR)
— Lack of physiological plausibility for the ACWR to be related to actual causes of injuries. It must be something other than workload that causes injury.
— Not valid for runners that train more than 20 miles/week or so. These were recreational runners with a low training volume and only running 2.4 days per a week on average.
Are the findings useful in application to training/coaching practice?
No.
The authors put out three theories as to why this paradoxical relationship may exist between lower acute versus chronic stress and running injuries. First they note that they had very few runners over 1.3 ACWR and that is likely because the population was recreational runners not looking to improve. More competitive runners may vary their training more. Other studies show more of a “U” shaped curve for ACWR and injury risk. This measure would be a lot more useful if it could prospectively predict injuries, but it seemingly behaves differently in different populations of runners and therefore makes it hard to actually use it.
What is my Rating of Perceived Scientific Enjoyment?
RP(s)E = 4 out of 10.
What was the beer called?
Galactic Cowboy Nitro.
Which brewery made it?
Left Hand Brewing Company (Longmont, Colorado, USA).
What type of beer is it?
Imperial double stout.
How strong is the beer?
9% ABV — kapow!
How would I describe this beer?
Dark chocolatey and liquoricey on the nose. Black and thick to the eye. Strong but smooth and yum on the tongue, and a slightly bitter, chocolatey aftertaste. This 9% galactic cowboy will take you to infinity and yee haa!
What is my Rating of Perceived Beer Enjoyment?
RP(be)E(r) = 8 out of 10.
What was the beer called?
City of Trees IPA
Which brewery made it?
Woodland Empire (Boise, USA).
What type of beer is it?
IPA.
How strong is the beer?
6.2% ABV.
How would I describe this beer?
Straw colored, slightly hazy with a nice dense foam. Smells of pine and hops. Tastes piney with a light malty body. Overall you get a good bit of astringent and bitter finish, much more typical of “traditional” old school IPAs rather than a hazy NEIPA. It’s one of the signature beers from Woodland Empire and while it’s not terribly unique or amazing, it is a solid sip that I’ll go to when I want to go local for out of town guests.
What is my Rating of Perceived Beer Enjoyment?
RP(be)E(r) = 6 out of 10.
That is all for this month's nerd alert. We hope to have succeeded in helping you learn a little more about the developments in the world of running science. If not, we hope you enjoyed a nice beer…
Until next month, stay nerdy and keep empowering yourself to be the best athlete you can be...
Everyday is a school day.
Empower yourself to train smart.
Think critically. Be informed. Stay educated.
Disclaimer: We occasionally mention brands and products but it is important to know that we are not sponsored by or receiving advertisement royalties from anyone. We have conducted biomedical research for which we have received research money from publicly-funded national research councils and medical charities, and also from private companies. We have also advised private companies on their product developments. These companies had no control over the research design, data analysis, or publication outcomes of our work. Any recommendations we make are, and always will be, based on our own views and opinions shaped by the evidence available. The information we provide is not medical advice. Before making any changes to your habits of daily living based on any information we provide, always ensure it is safe for you to do so and consult your doctor if you are unsure.
If you find value in these nerd-alerts, please help keep them alive and buy us a beer:
If you enjoy this free content, please like and follow @veohtu, @mjlaye and @thomaspjsolomon and share these posts on your social media pages.
About the authors:
Matt and Thomas are both passionate about making science accessible and helping folks meet their fitness and performance goals. They both have PhDs in exercise science, are widely published, have had their own athletic careers, and are both performance coaches alongside their day jobs. Originally from different sides of the Atlantic, their paths first crossed in Copenhagen in 2010 as research scientists at the Centre for Inflammation and Metabolism at Rigshospitalet (Copenhagen University Hospital). After discussing lots of science, spending many a mile pounding the trails, and frequent micro brew pub drinking sessions, they became firm friends. Thomas even got a "buy one get one free" deal out of the friendship, marrying one of Matt's best friends from home after a chance encounter during a training weekend for the CCC in Schwartzwald. Although they are once again separated by the Atlantic, Matt and Thomas meet up about once a year and have weekly video chats about science, running, and beer. This "nerd alert" was created as an outlet for some of the hundreds of scientific papers they read each month.
To read more about the authors, click the buttons:
 and Matt Laye PhD
 What was the hypothesis or research question?